


0
Currency & Commodity Analysis:
US Dollar Index
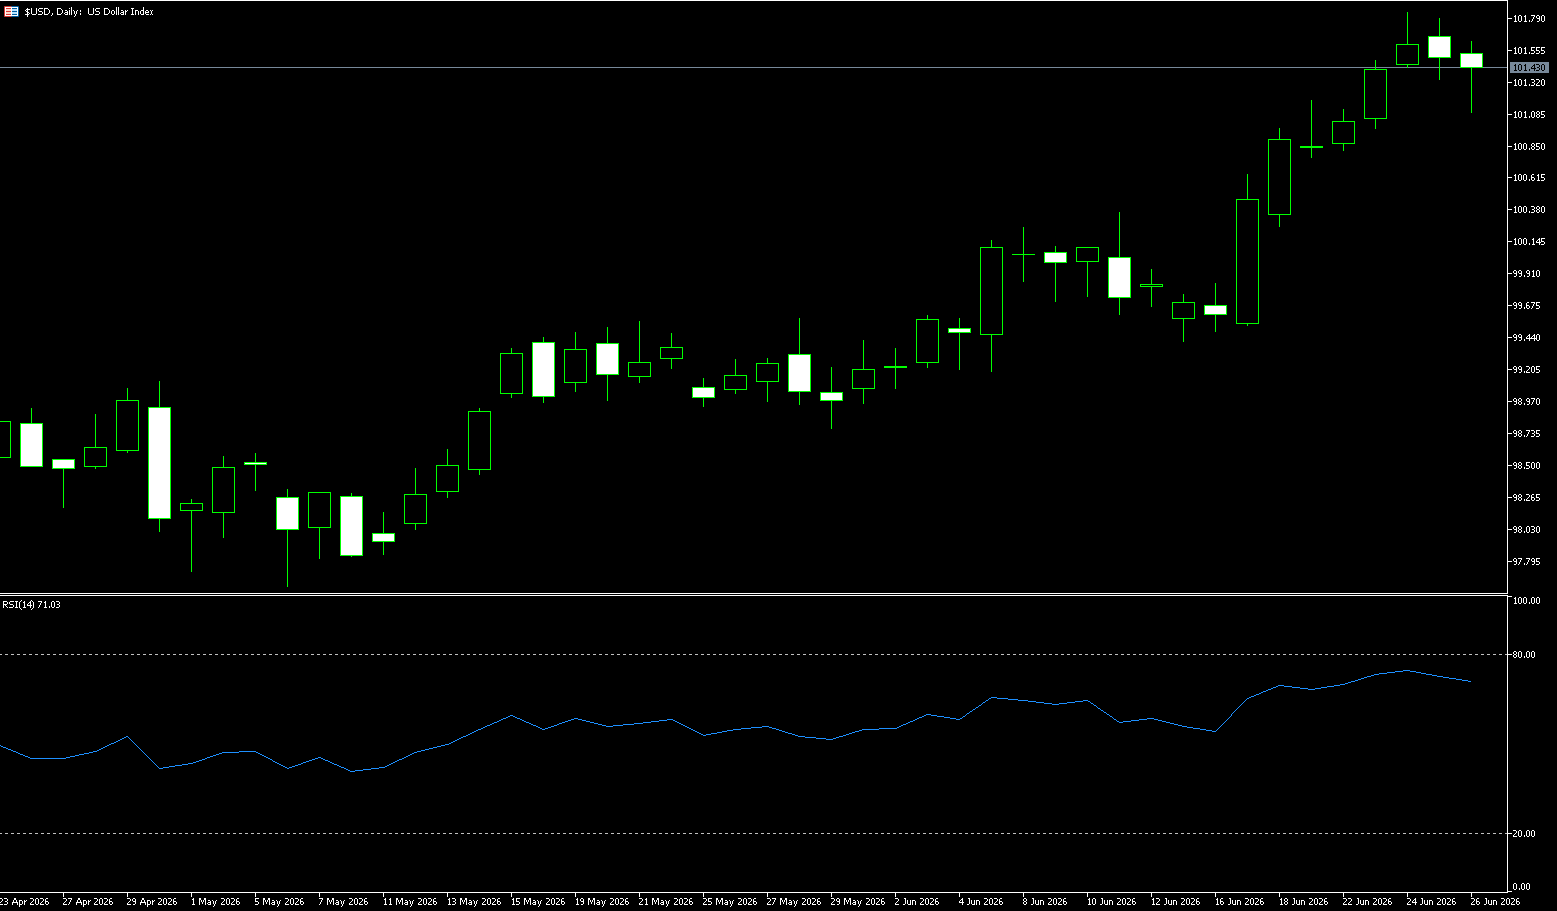
Last week, the US dollar index fluctuated around 101.40, reaching a 13-month high of 101.80, with June's gains potentially marking the largest in nearly a year. Rising expectations of a Fed rate hike, hawkish signals from Warsh, and a widening US-German interest rate differential exceeding 150 basis points collectively underpinned the dollar's strength. The core macroeconomic backdrop for the dollar's strength lies in the fact that energy price volatility triggered by the Middle East situation reversed market expectations for Fed easing this year. Previously, the market widely anticipated a Fed rate-cutting cycle, but geopolitical conflicts pushed up energy prices, exacerbating inflationary pressures and forcing the market to reassess its policy path. Simultaneously, consistently better-than-expected US economic data—recently, a broad-based strengthening of PMIs—reinforced the narrative of "American exceptionalism," providing solid fundamental support for the dollar.
Although the current "positive feedback loop" of the dollar is strong, this momentum could quickly exhaust itself under two key scenarios, triggering a risk of exchange rate correction. One is that inflation data falls short of expectations. The US core PCE inflation indicator for May was significantly lower than market expectations, indicating a continued easing of inflationary pressures. Investors' bets on a Fed rate hike in October will cool rapidly, and the dollar index may experience a rapid pullback, even erasing some of its recent gains. Secondly, geopolitical risks have eased significantly. If the US-Iran peace agreement negotiations achieve a substantial breakthrough, the situation in the Middle East stabilizes, and navigation in the Strait of Hormuz fully resumes, further declines in oil prices will alleviate global inflationary pressures, weakening the need for the Fed to maintain a hawkish stance, thereby diminishing the dollar's interest rate advantage and safe-haven support.
The dollar index is currently maintaining a strong bullish trend, having reached a high of 101.80. The moving average system is in a complete bullish alignment, firmly holding above the 20-day, 50-day, 100-day, and 200-day moving averages. The short-term 20-day moving average (100.25) provides strong dynamic support, and all moving averages are diverging upwards in tandem, indicating a solid upward trend structure. The MACD indicator shows the DIFF line (0.6006) consistently above the DEA line (0.4476), with the red histogram expanding, indicating strong bullish momentum and no signs of a top divergence or reversal. The RSI indicator has risen to 72.48, approaching the overbought 80 level, suggesting a short-term technical pullback to correct the indicator, but this does not undermine the medium- to long-term upward trend.
Overall, the market is dominated by bulls. The short-term RSI is nearing overbought territory, indicating a potential for a slight pullback. A pullback to the short-term moving average support level could present a buying opportunity. A breakout above 101.80 (this week's high, a key level for bulls and bears) with significant volume would further open up upward potential. A daily close above 102.00 (a psychological level) would target 102.69 (the low of September 2024), and a break above that would target 103 (a psychological level). Only a decisive break below the psychological level of 101.00 and the 9-day simple moving average area would allow the US dollar index to potentially reverse its short-term bullish trend and move towards the key psychological level of 100.00.
Today, consider shorting the US dollar index at 101.50, with a stop-loss at 101.60 and targets at 101.20 and 101.10.
WTI Crude Oil
The latest cruise ship attack coincided with the US and Iran reaching a preliminary ceasefire and strait navigation agreement, severely impacting market optimism regarding the resumption of shipping in the Strait of Hormuz. The International Maritime Organization (IMO) subsequently suspended its ship guidance program, exacerbating uncertainty. Rystad Energy stated that Gulf oil storage tanks are only at 50%-60% capacity; if tanker shipping cannot effectively recover, oil-producing countries will face pressure to reduce production, and a full supply chain recovery may be delayed until next year. This incident reflects the fragility of mutual trust between the US and Iran and the long-term vulnerability of the Strait of Hormuz. Oil prices have already been priced in, increasing the probability of Middle Eastern export disruptions. Recently, the US and Iran signed a memorandum of understanding, agreeing to a 60-day window for negotiations on a permanent ceasefire in the Middle East, but many conflicts have not been truly resolved. Strait of Hormuz shipping, the Lebanon-Israel conflict, and the US-Iran rivalry continue to influence crude oil pricing.
Trump stated that he had communicated with oil companies today, and that their current efforts to lower gasoline prices have not yet met expectations, demonstrating his determination to suppress oil prices. Currently, the market has two main disagreements regarding the purpose of Iran's tough measures: is this a retaliatory measure against the US and Gulf states opening alternative shipping routes, or a preemptive move by Iran to secure sovereignty over the Strait of Hormuz? There is no definitive conclusion yet, but regardless of the initial intention, it will continue to provide geopolitical support for oil prices.
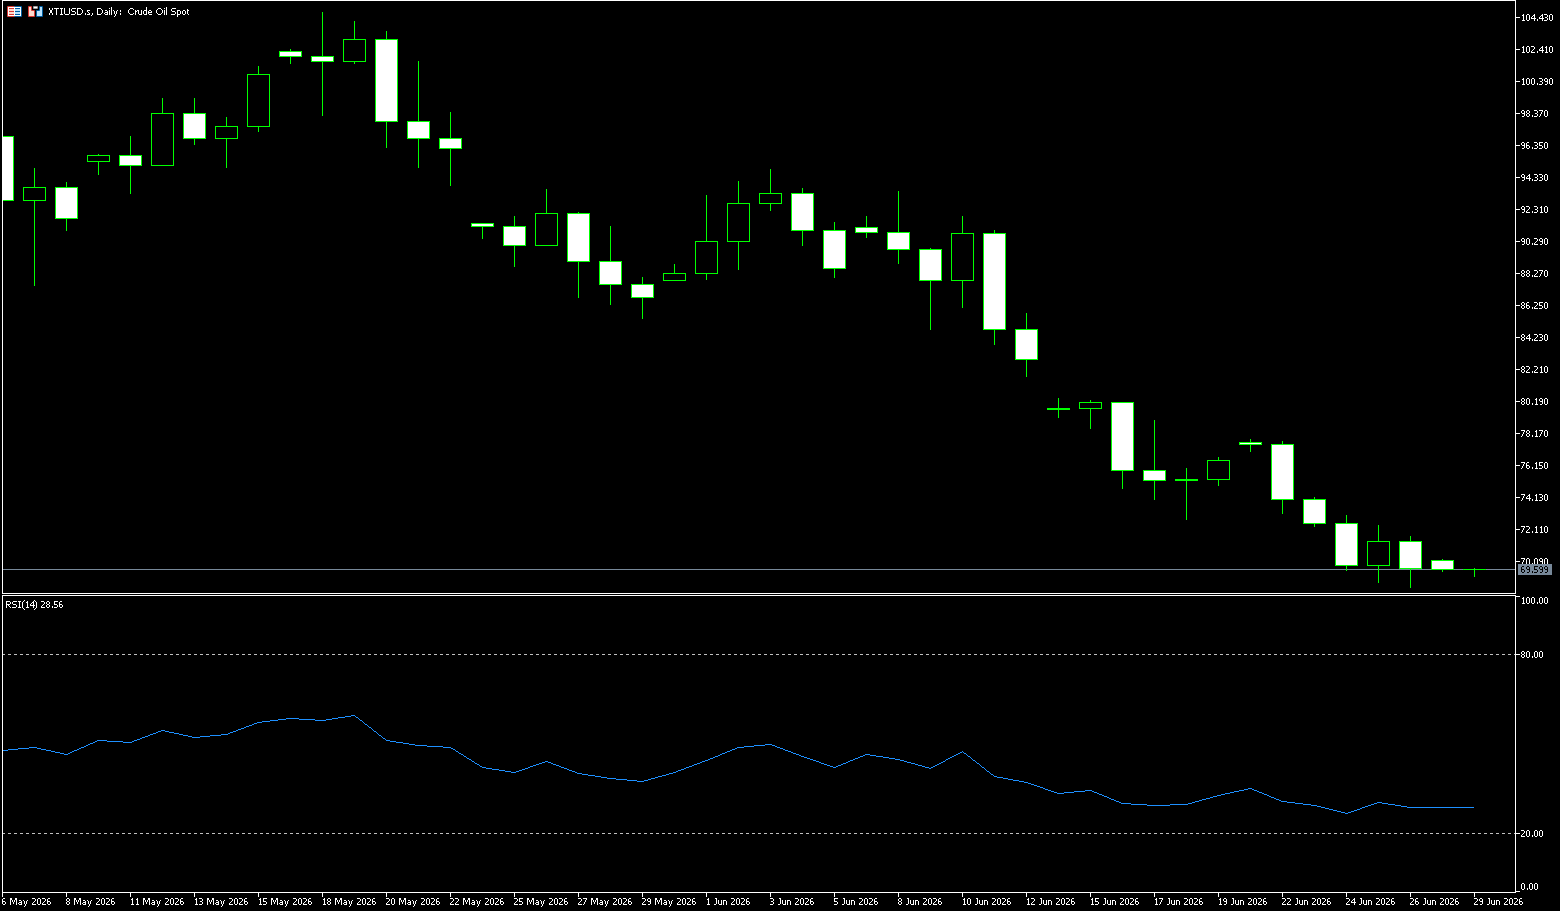
Last week, WTI spot prices experienced a general unilateral decline, rebounding to above $70 before the weekend. The weekly chart closed with a long lower shadow and a large bearish candlestick, with a weekly decline of approximately 7.5%. The continued clearing of geopolitical risk premiums and expectations of the resumption of navigation in the Strait of Hormuz suppressed oil prices, resulting in consecutive daily declines, breaking through the psychological levels of $73 and $70. The price bottomed out at $68.80 mid-week, a four-month low. Regarding the moving average system, the 5-day, 10-day, and 20-day moving averages are all trending downwards, indicating that any short-term rebound will continue to face selling pressure from these moving averages. The MACD indicator is below the zero line, with downward momentum converging and a golden cross beginning to form, suggesting conditions for a continued short-term rebound. The RSI (14) has rebounded from oversold levels of 26 to 30, but has not yet broken above the 50 level, limiting the upside potential. Currently, the price is holding above the gap created by the war, which is a classic technical analysis strong support level, especially the original gap. Any negative developments affecting the US-Iran peace talks or data reflecting economic growth will likely be met with resistance.
Today, consider going long on crude oil at 70.00, with a stop-loss at 69.80 and targets at 73.00 and 72.00.
Spot Gold
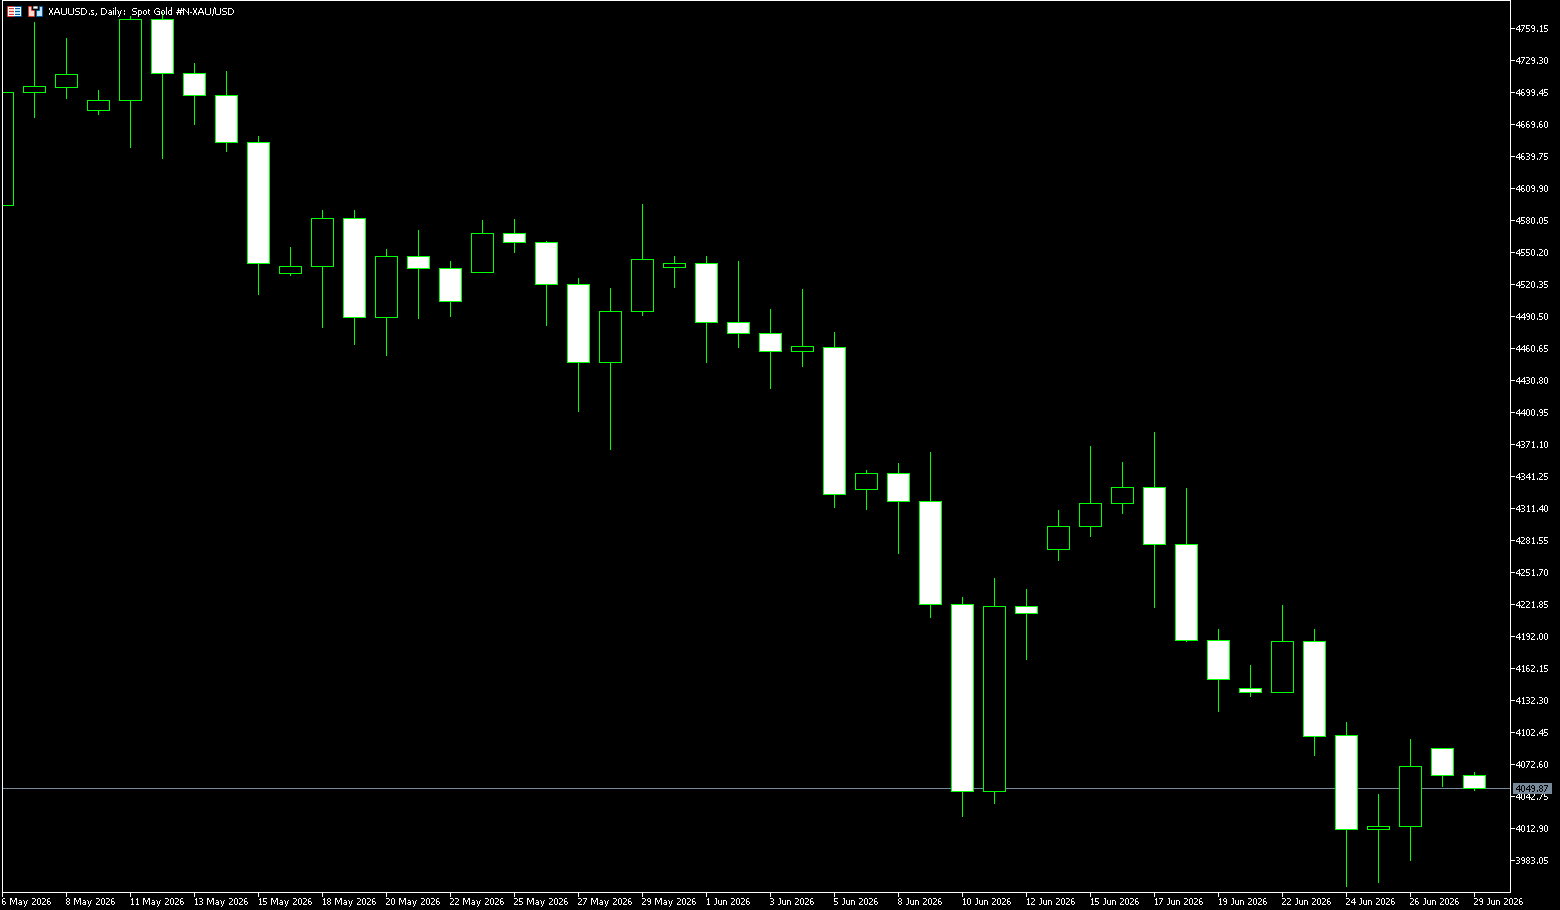
Gold prices rebounded from a year-to-date low of $3,959.50 to above $4,000 per ounce before the end of last week. This week, it is expected to fall by about 3%, as hawkish signals from the Federal Reserve outweigh support from US-Iran peace efforts. Last week, gold prices rebounded slightly after the latest US personal consumption expenditure (PCE) inflation data largely met expectations, easing concerns about an imminent Fed rate hike and pushing down the dollar and Treasury yields. Nevertheless, the market expects an 80% probability of a Fed rate hike in December, compared to about a 63% probability in September. Meanwhile, oil prices continued to decline, returning to pre-conflict levels, as progress in US-Iran peace talks eased concerns about Middle East supply disruptions and further reduced inflation worries.
In summary, the recent rebound in gold prices above $4,000 is both an immediate reaction to the "soft landing" of inflation data and a reflection of investors' repricing of the complexities of the macroeconomic environment. In the short term, any recurrence of geopolitical risks, oil price fluctuations, and uncertainty surrounding the Fed's policy path will continue to provide safe-haven buying support for gold. In the medium to long term, as long as inflationary pressures do not completely subside to the Fed's 2% target range, the upside potential for real interest rates will be limited, and gold, as a traditional asset to hedge against inflation and currency devaluation, will continue to offer significant investment value. Of course, the market is not unilaterally bullish. Strong economic data and the potential for interest rate hikes may still suppress gold prices in the short term. However, as historical experience shows, in an environment of high inflation and policy uncertainty, gold often demonstrates strong resilience and periodic explosive potential.
Currently, the significance of the $4,000 gold price level goes beyond just being a psychologically significant psychological level. The upward trend in gold over the past year has been driven by three main factors: continued buying by central banks, a preference for hard assets due to sticky inflation, and previous market bets on the Fed's interest rate cut path. Now that the third main trend has reversed, prices naturally need to compress the previously overdrawn risk premium. Gold has fallen nearly 12% this month, but is still up about 20% year-on-year, indicating that the crowded trading at high levels has been forced to cool down. Last week's overall structure: an initial rebound met resistance, a sharp drop occurred mid-week, Thursday's PCE data triggered an oversold correction, and Friday saw further pressure and a decline. The entire week was dominated by bears, characterized by a high-level breakdown and accelerated decline followed by low-level consolidation and bottoming. Technically: two consecutive large bearish candles in the first half of the week formed a breakdown and accelerated decline; while the single bullish candle in the second half of the week failed to break through short-term resistance, representing a continuation of the downtrend. Technical indicators: the daily MACD remains negative and downward, indicating bearish dominance; the RSI touched a low of 29 in the oversold zone, suggesting a short-term rebound demand, but the rebound's height is limited.
From a technical perspective, the rebound from oversold conditions in the latter half of last week stalled before reaching the $4,083 level (the 5-day simple moving average), which had previously acted as support, became resistance. This, coupled with recent failures near the 25-day simple moving average (4302) and weakness below $4,000, confirms the negative short-term outlook for gold. On the upside, initial resistance lies around the $4,150 level; a break above this level could push gold towards $4,220 (last week's high). However, any further gains are likely to be viewed as selling opportunities and limited near the 20-day simple moving average, around $4,249. Failure to challenge this resistance level will keep the short-term bias downward. On the downside, the first support is at the psychological level of $4,000, followed by last week's low of $3,959.50. A break above this level would target the psychological level of $3,900.
Consider going long on gold today at $4,084, with a stop-loss at $4,080 and targets at $4,150 and $4,170.
AUD/USD
Last week, Australia's May employment data exceeded expectations, with the unemployment rate falling and new jobs filling the gap left by April's job losses. Part-time jobs contributed to employment growth, and while job vacancies declined slightly, the overall job market remained tight. Strong employment exacerbated inflation control pressures. Currently, core inflation has exceeded the target range, and the minimum wage increase may further push up prices. Industry institutions predict a possible interest rate hike, and June's inflation data will determine the central bank's subsequent interest rate decisions. The stock market also fluctuated due to concerns about interest rate hikes. Although Australian data showed resilience in consumer demand and the job market, the Australian dollar remained suppressed near multi-week lows due to the generally strong US dollar.
Looking at all indicators of employment, inflation, and economic growth, Australia's current macroeconomic situation shows a clear divergence. Slower economic growth and a slight decline in job vacancies indicate that the interest rate hike policy has shown some initial effectiveness. However, the unwavering resilience of the job market, persistently high core inflation, and the minimum wage increase continue to push up inflation risks. Strong May employment data failed to fundamentally alleviate the Reserve Bank of Australia's inflation control pressures, further strengthening market expectations for another interest rate hike this year. The June inflation data will be a key watershed moment influencing the central bank's decisions. Australian equity and foreign exchange markets will continue to fluctuate around inflation and interest rate hike expectations, and market volatility caused by tightening macro policies will persist.
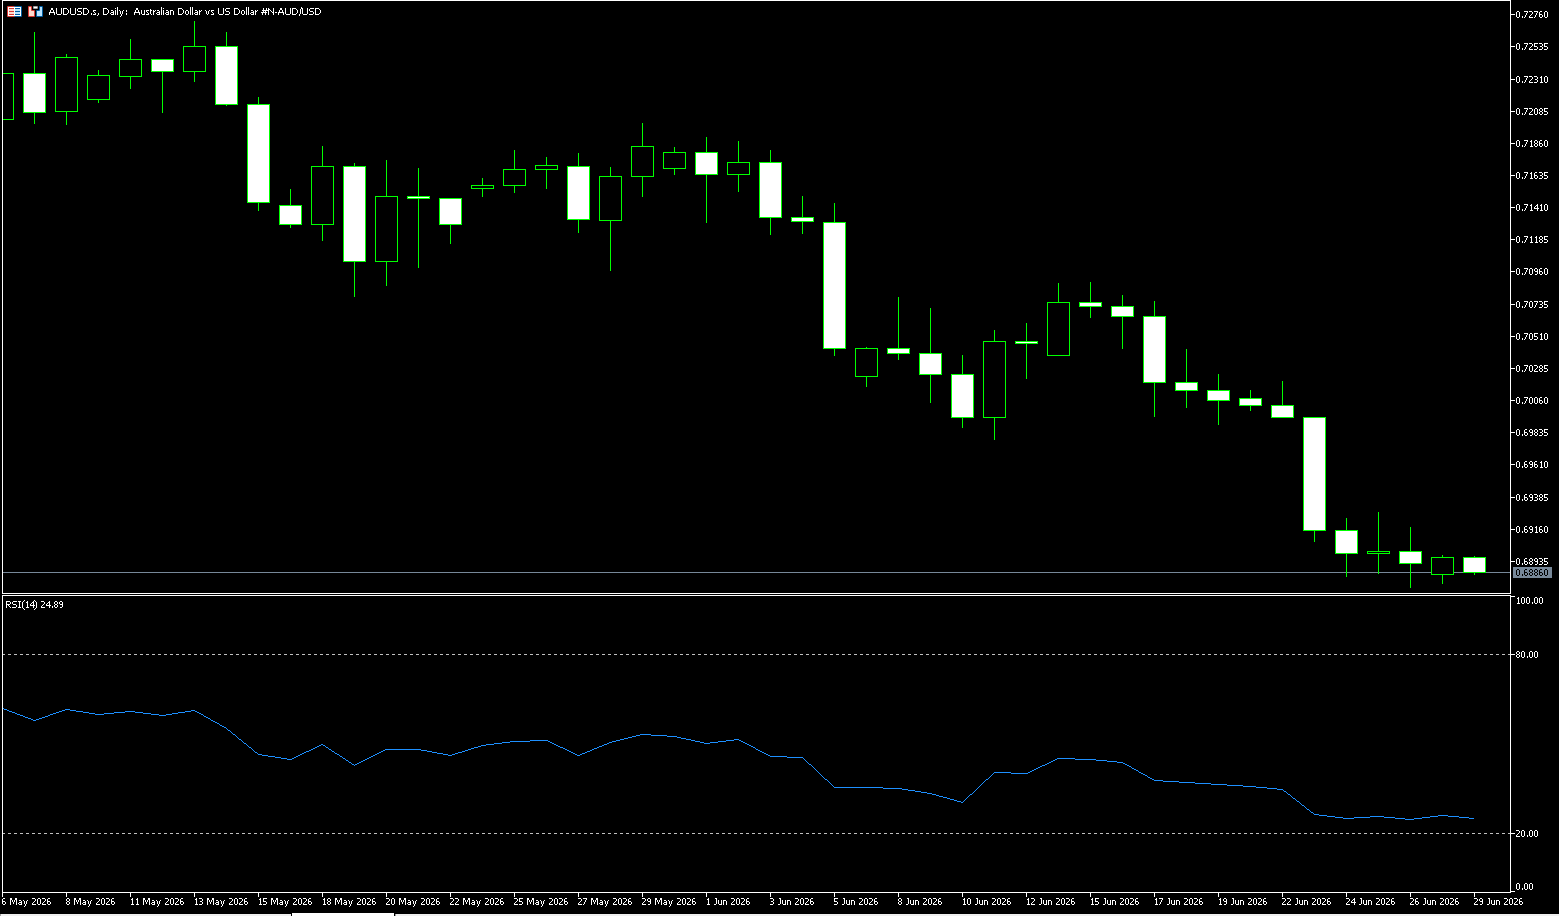
Last week, the Australian dollar/US dollar pair exhibited a one-sided downward trend, breaking down through key support levels. The widening interest rate differential between the US and Australia, continued weakness in commodities (iron ore, copper), and global safe-haven inflows into the US dollar all contributed to the downward pressure on the commodity currency, the Australian dollar. The Australian dollar weakened against the US dollar around 0.6900, maintaining a short-term bearish bias, as the spot price remained below the 9-day simple moving average of 0.6968 and the psychological level of 0.7000. The pair has slipped below short-term trend indicators, and the Relative Strength Index (RSI) is at 27.08, in oversold territory, suggesting that while downward pressure is dominant, the recent decline has become excessive. The MACD indicator shows a widening bearish crossover below the zero line, with the green bars lengthening, indicating strong downtrend momentum.
On the upside, initial resistance lies at the 9-day simple moving average around 0.6970 and the psychological level of 0.7000; a retest of this level is needed to alleviate the immediate bearish sentiment and potentially challenge 0.7057. On the downside, the 200-day simple moving average at 0.6859 and the March 30 low of 0.6833 will be key support levels; a break below these levels would put the pair under pressure at the psychological support level of 0.6800 and the January 7 high of 0.6766.
Today, consider going long on the Australian dollar at 0.6882, with a stop-loss at 0.6870 and targets at 0.6950 and 0.6940.
GBP/USD
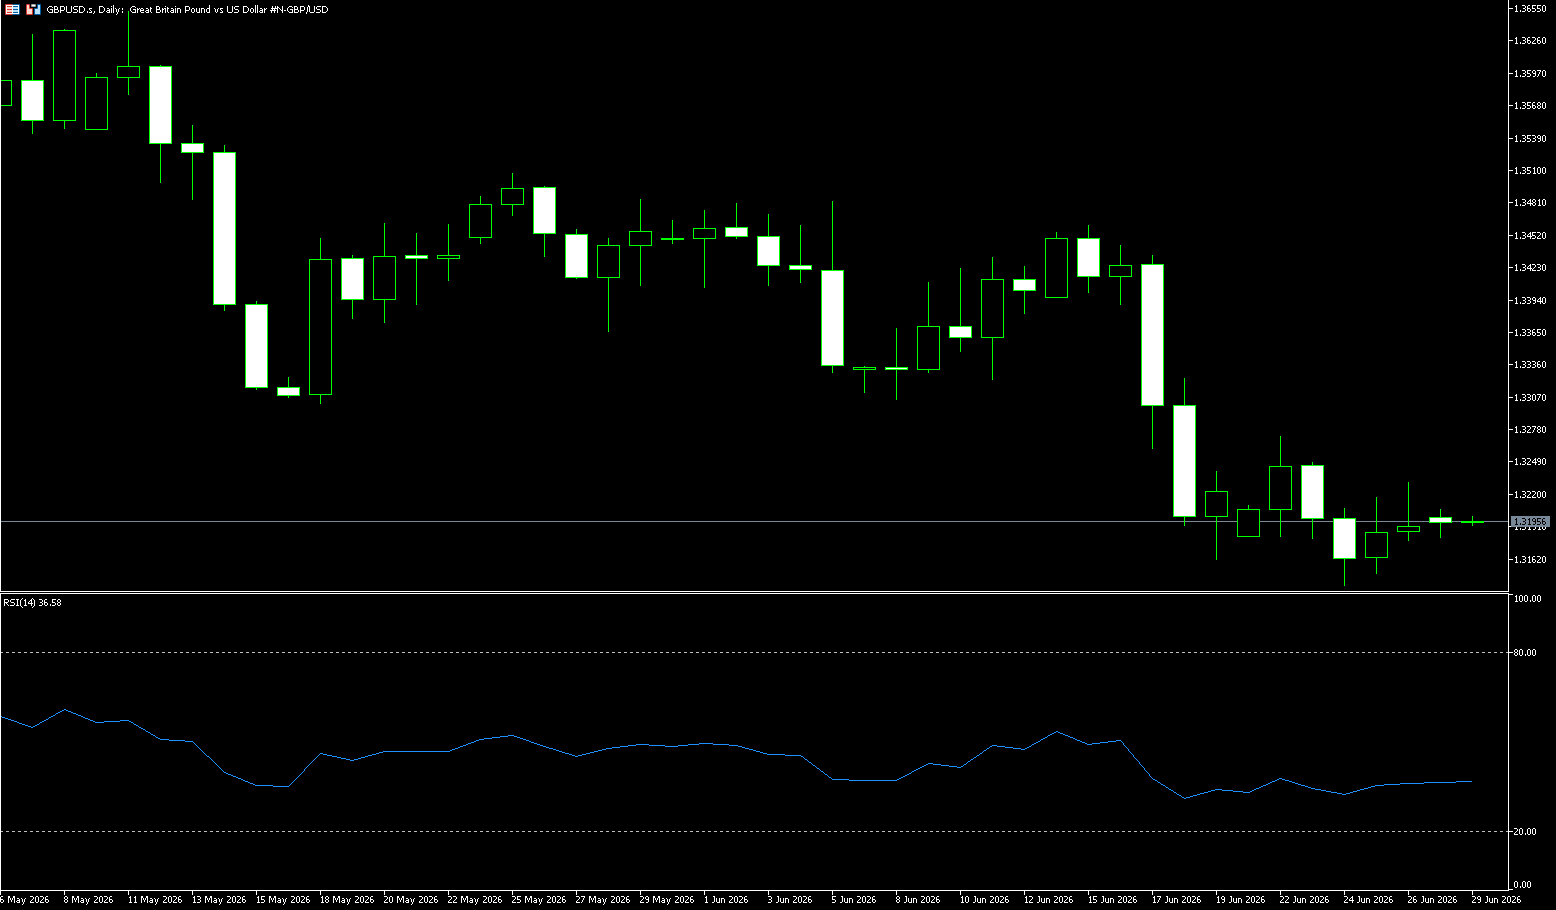
Last week, the resignation of British Prime Minister Keir Starmer triggered a new round of political uncertainty, putting continued pressure on the pound. Although the pound/dollar pair rebounded to around 1.3232 at one point, the overall trend remained weak. Meanwhile, expectations of a Fed rate hike continued to rise, keeping the dollar at a high level and putting additional pressure on the pound. Recently, there have been significant changes in British politics. Prime Minister Keir Starmer announced his resignation on Monday, triggering market concerns about the future direction of British policy. This resignation occurred after the Labour Party's defeat in the Mekfield by-election, and the rapidly escalating political pressure ultimately led to Starmer's departure. The changing political situation in the UK is increasing the uncertainty facing the pound, while rising expectations of a Fed rate hike continue to strengthen the dollar's advantage. Both factors combined have resulted in the pound/dollar pair maintaining an overall weak trend.
As the UK enters a new phase of leadership transition, the market remains highly focused on the direction of future fiscal policy. Investors are assessing Andy Burnham's potential economic policies and their impact on the UK's fiscal situation. Some market participants believe that if the government adopts more aggressive fiscal expansion measures in the future, while raising taxes and increasing the scale of government bond issuance, it may increase the UK's fiscal pressure and challenge the attractiveness of sterling assets. Political uncertainty often weakens international capital's willingness to allocate to domestic assets, and the UK economy itself still faces problems such as slowing growth, weak consumption, and fiscal balance pressures, thus the market's risk appetite for the pound has declined.
Last week, the overall market exhibited a weak oscillating structure, initially dipping, then consolidating in a narrow range at low levels, with a high probability of a weekly close in the red, indicating that bears dominate the short-term market. In the short term, the pound faces some adjustment pressure, and the market will digest the signal of this "hawkish stabilization." If subsequent economic data and energy prices remain stable, the downside potential may be limited. In the long term, the potential support of a moderate recovery in UK economic growth and the global interest rate environment will jointly determine the characteristics of the exchange rate's range. From the daily chart, the pound against the dollar is still in a downward trend overall. The exchange rate recently broke below the previous consolidation platform and has continued to decline. Although it has rebounded to around 1.3200, the overall bearish trend remains unchanged. The price continues to trade below the major moving average system, indicating that bears still hold the upper hand in the market. Technical indicators: MACD: DIFF remains below the zero line, and the bearish momentum bars have slightly contracted, indicating only a short-term halt to the decline, not a reversal; while RSI (14): is running stably in the 33-38 weak range, without oversold divergence, and the rebound lacks momentum support;
Currently, the recent rebound height of GBP/USD has been decreasing, with the low point remaining flat, which is a continuation pattern in the downtrend, rather than a bottom reversal; the 14-day moving average on the daily chart is at 1.3296, and the psychological level of 1.3300 has suppressed the rebound throughout, with selling pressure appearing every time it is touched; the 20-day moving average at 1.3330 has turned downwards, forming a bearish pattern; the key support levels to watch are 1.3132 (lower Bollinger Band) and the psychological level of 1.3100. If 1.3100 is breached, there is a risk of further decline to the 1.3000 (psychological level) area. On the upside, the first resistance level to watch is 1.3273 (last week's high), followed by 1.3300 (the psychological level) and the 1.3350 area.
Today, consider going long on GBP at 1.3184, with a stop loss at 1.3170 and targets at 1.3250 and 1.3240.
USD/JPY
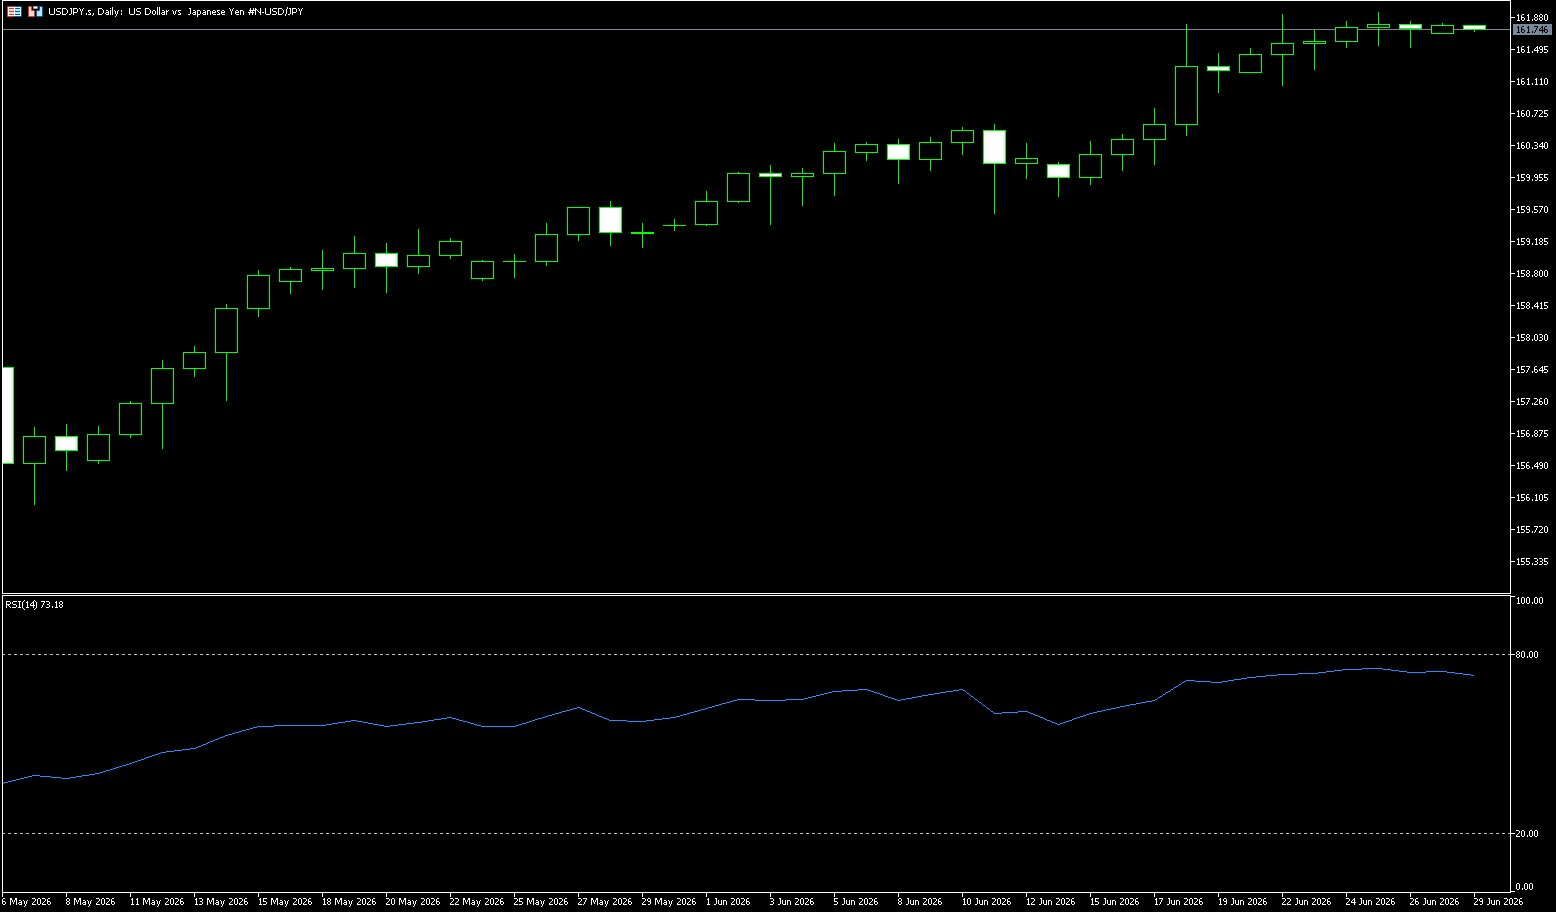
USD/JPY traded in a range near 162.00 for most of last week, close to multi-decade highs and not far from recent multi-decade highs. While the Federal Reserve maintained a hawkish stance, supporting the dollar, the Japanese government's recent frequent signals of currency intervention have fueled speculation of a joint US-Japan intervention in the foreign exchange market, limiting further upside potential. The market is currently focused on the Fed's future policy path and potential intervention measures by the Japanese authorities; these two factors will be key variables influencing the USD/JPY exchange rate. The recent continued depreciation of the yen has become a focus of the global foreign exchange market. As the US dollar approaches historical highs against the Japanese yen, the Japanese government's concerns about excessive exchange rate volatility have clearly intensified. Japanese Finance Minister Satsuki Katayama recently met with US Treasury Secretary Scott Bessenter, and both sides indicated they would take action on exchange rate issues if necessary. This statement quickly sparked market speculation about possible joint intervention in the foreign exchange market by the US and Japan.
Meanwhile, Japanese Chief Cabinet Secretary Minoru Kihara reiterated that the government is closely monitoring foreign exchange market dynamics and will take appropriate measures to address abnormal exchange rate fluctuations if necessary. The market generally believes that as the US dollar has remained above 160 against the yen for an extended period, the Japanese authorities' tolerance for exchange rate movements is decreasing. However, factors supporting the US dollar remain. The Federal Reserve decided at its June monetary policy meeting to maintain the federal funds rate at 3.50%-3.75%, but the overall policy tone remained hawkish. Newly appointed Federal Reserve Chairman Kevin Warsh emphasized at his first press conference that "price stability" will continue to be a core objective of monetary policy, indicating that policymakers remain vigilant about inflation risks.
Last week's USD/JPY pair showed the following overall characteristics: the bullish trend remained intact at high levels, but approaching a 40-year historical resistance zone, overbought conditions put pressure on the pair, leading to increased volatility, and expectations of intervention limited further upside. The USD/JPY pair is currently at a critical juncture where fundamental and policy risks intertwine. The Fed's hawkish stance and rising market expectations of interest rate hikes continue to support the dollar, while frequent intervention signals from the Japanese government have limited further gains. Last week, the bulls continued their upward momentum, pushing the pair to 161.93, approaching the 2024 high of 161.96 (Japan's official psychological support level), and closing with a long upper shadow bullish candlestick. Currently, the pair is consolidating at high levels, with the range narrowing to 161.300–161.93. The bulls are unable to break new highs, repeatedly testing the 161.90 level before retreating, and carry traders are increasingly seeking profit-taking.
Technical indicators: MACD: Running above the zero line, the red bars are continuously narrowing, indicating weakening bullish momentum; while the 14-day Relative Strength Index (RSI): hovering repeatedly in the 70-73 range, severely overbought, potentially triggering a technical pullback at any time; on the other hand, USD/JPY saw a surge in trading volume with shrinking volume, indicating insufficient buying pressure, with bulls relying solely on carry trades for passive support. Currently, the 162 level is a red line for the Japanese authorities. If explicit intervention occurs, the exchange rate could fall by 100-150 points in a single move, targeting 161.10 (the 10-day moving average) and 161.00 (the psychological level); if it continues to fall under pressure, it will first drop to 160.57 (the 20-day moving average), and after that, test the psychological level of 160.00. Conversely, a valid break and hold above 162.00 (the intervention level) could open up new upside potential, further targeting the 163.50 and 165.00 areas.
Today, consider shorting the US dollar at 161.90, with a stop-loss at 162.10 and targets at 161.20 and 161.00.
EUR/USD
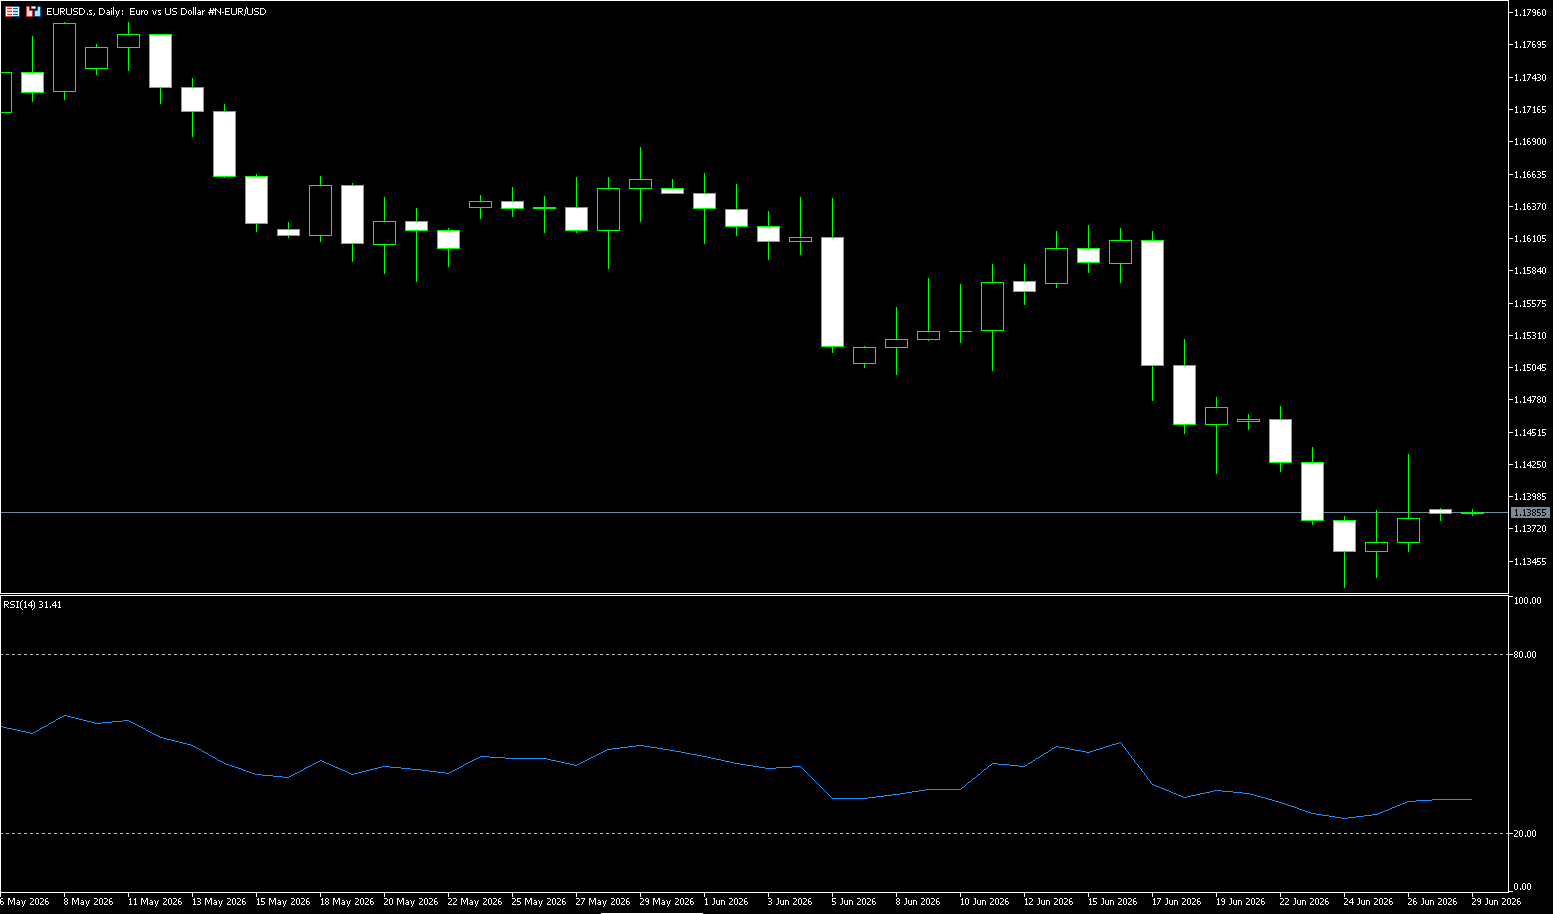
Last week, the EUR/USD pair continued its weakening trend, hitting a new one-year low. The current exchange rate has fallen back to around 1.1380, representing a maximum drop of 6% this year. The core driver of this round of euro depreciation is the strong rebound of the US dollar. The dollar index has climbed to around 101.40, a new high in over a year. Against the backdrop of rising expectations of a Fed rate hike, most developed and emerging market currencies are under downward pressure. It is worth noting that this round of euro decline exhibits a clear divergence: the European Central Bank raised interest rates two weeks ago, theoretically beneficial to the euro exchange rate, but the strong dollar completely offset the ECB's policy benefits, causing the euro to continue its one-sided weakness. Currently, the market's bullish and bearish battle is focused on key US inflation data.
Meanwhile, the Federal Reserve signaled a clear interest rate hike, indicating a high probability of a 25 basis point increase this year. The rising expectations of a rate hike attracted global funds into dollar assets, providing core support for the strengthening of the dollar index. In contrast, while the European Central Bank (ECB) recently implemented interest rate hikes, the policy力度 (intensity/strength) and market impact were far less than the Fed's. Simultaneously, the market continued to revise its expectations for ECB policy, and subsequent statements from ECB officials were more hawkish than Lagarde's initial remarks, gradually cooling market expectations for tightening policies in the Eurozone. The interest rate differential between the US and Europe continued to widen, directly suppressing the euro exchange rate.
Last week, the euro/dollar pair continued its medium-term downtrend, generally trending downwards with lower lows. Bullish rebounds were extremely weak, failing to change the dominant bearish trend. The overall center of gravity shifted downwards throughout the week, with all moving averages providing resistance, representing a typical weak and volatile market. On the daily chart, the euro/dollar continued its decline, breaking below the 20-day simple moving average of 1.1515 and remaining well below the 10-day simple moving average of 1.1455, indicating a clearly bearish overall trend. The currency pair is currently near the lower Bollinger Band at 1.1342, while the 14-day Relative Strength Index (RSI) is around 30, indicating oversold territory and suggesting that downside potential has been extended, but no clear rebound signal has yet appeared. The MACD DIFF line remains below the DEA and below the zero line; although the green bars have shortened slightly, a golden cross has not formed, indicating only a slowdown in the decline, not a trend reversal.
Therefore, the immediate support level is at 1.1300 (a psychological level). A sustained break below this level would open up further downside potential, targeting 1.1210 (the low from last May) and then 1.1200 (the psychological level). Initial resistance is at 1.1400, followed by the March 13 low of 1.1411, then the 10-day simple moving average at 1.1470 and the 1.1500 (psychological level). Only a break above this layer of resistance could alleviate the current bearish pressure.
Today, consider going long on the Euro at 1.1370, with a stop-loss at 1.1360 and targets at 1.1420 and 1.1430.
Stock Analysis:
Australian ASX 200 Stock Index
Basic Market Overview:
The Australian Securities Exchange (ASX) 200 index fell 60 points, or 0.7%, to close at 8,749 on Thursday, erasing the previous day's modest gains and hitting a two-week low. Stronger-than-expected employment growth in Australia in May reinforced market expectations that the Reserve Bank would maintain a hawkish stance, with Deputy Governor Andrew Hauser emphasizing that inflation remained "too high" and more jobs might be needed. Nevertheless, losses were limited by strength in US stock index futures, after the S&P 500 and Nasdaq fell for the third consecutive day, led by technology stocks. Non-energy mining, energy, electronics, and industrial services sectors were weak, with gold mining companies declining as gold prices fell to a seven-month low. Evolution Mining (-3.9%) and Northern Star Resources (-3.1%) fell sharply. In addition, the four major banks saw share prices fall between 1.2% and 3.7%. Energy stocks Woodsside (-3.3%) and Santos (-2.6%) fell as oil prices returned to pre-war levels with Iran. Judo Capital shares plunged 39% after lowering its 2026 earnings forecast.
Sector Performance:
Top Performing Sectors This Week (Defensive Themes with Strong Fund Inflows)
1. Healthcare (Weekly +2.5%, Strongest Performer This Week)
• Rally Logic: Safe-haven fund rotation, Australian dollar depreciation benefiting pharmaceutical companies with overseas revenue, continued institutional buying in defensive sectors
• Leading Stocks: CSL, Cochlear, Pro Medicus; Medical device and bio-testing stocks all strengthened
2. Consumer Discretionary (Weekly +2.1%)
• Rationale: Strong employment data boosting domestic demand, improved sentiment in tourism and retail; easing of US-Iran tensions benefiting aviation and cultural tourism
• Representatives: Qantas Airways, offline retail chains
3. Consumer Staples (Weekly +1.4%)
• Rationale: Inflation-hedging essential demand, A2 Milk dividend + brokerage rating upgrades driving the sector higher, reaching a new high for the year
4. Real Estate REITs (Weekly +1.1%)
• Logic: US Treasury yields have fallen in stages, making real estate dividend assets more attractive.
This week's leading decliners (cyclical resources under pressure across the board)
1. Energy Sector (Weekly -2.48%, weakest in the market)
• Reasons for decline: Easing US-Iran talks, WTI crude oil price decline; market concerns about weakening global oil demand
• Leading stocks weaken: Woodside Energy and Santos continued to decline
2. Raw Materials/Mining (Weekly -2.28%)
• Reasons: A stronger US dollar pressured iron ore, copper, and gold prices; cooling expectations for China's recovery led to profit-taking at high levels for BHP and Rio Tinto
• Sub-sectors: Lithium and rare earths weakened simultaneously, with only gold mining showing a slight recovery on Friday.
3. Financial Sector (Weekly -1.22%)
• Reasons: Long-term government bond yields fell, market expectations that the Reserve Bank of Australia's rate hike cycle was nearing its end suppressed expectations for bank net interest margins; the four major banks collectively weakened.
4. Information Technology (Weekly - 0.8%
• Logic: US AI software stocks collectively retreated, global tech stocks underwent valuation corrections, and WiseTech and cloud computing stocks continued to be under pressure.
Technical Analysis:
Last week, the Australian ASX200 stock index exhibited a high-level consolidation pattern, lacking upward momentum: no clear unilateral trend, entering a short-term consolidation range. Pattern characteristics: multiple consecutive long upper shadow candlesticks, persistent selling pressure above, and a lack of volume support for bullish attacks, indicating a consolidation phase after the rise. No trend reversal signal appeared, but upward momentum clearly weakened. The current RSI indicator is around 69, approaching the overbought threshold of 70, indicating a potential top divergence risk: While prices have repeatedly surged, the RSI has failed to reach new highs, suggesting weakening bullish momentum and an accumulating need for a short-term pullback. Meanwhile, the daily MACD histogram is shortening, and the fast line (DIF) is flattening and about to converge with the slow line (DEA), indicating a weakening short-term bullish trend. The 5-day moving average is at 8725 (a key level for short-term strength/weakness); the index is currently closely above this level. A sustained hold above this level would maintain the current range-bound trading, while a break below would target the 8650 support level. The 20-day moving average is at 8640 (a crucial level for the medium-term bullish trend); as long as the index doesn't break below this level within 3-5 days, the overall upward trend remains intact. Furthermore, this week's trading saw decreasing volume on rallies and increasing volume on declines, a typical weak, range-bound volume-price structure. The rebound lacks new capital inflows, and selling pressure from resource and cyclical sectors continues to suppress the index's upward potential.
Trading Strategy:
The following are technical trading ideas only and do not constitute investment advice. Leveraged trading may result in losses exceeding the principal.
Bull Strategy (Only consider small long positions on pullbacks to support levels)
1. Entry Conditions: The index retraces to the 8730-8740 range and stabilizes; the healthcare/consumer sector leads the gains.
2. Target Stocks: Leading healthcare stocks, essential consumer stocks.
3. Take Profit: 8775-8800; Stop Loss: Exit if the price falls below 8700.
4. Position Size: 10%-15% of total capital; quick in and quick out, avoid overstaying your welcome.
Short-selling strategy (sell on rallies)
1. Entry conditions: Rebound to 8775-8790 encountering resistance; energy/mining continuing to lead the decline;
2. Short-selling targets: Energy, major mining companies BHP/RIO, and the four major banks;
3. Take profit: 8730, 8680; Stop loss at 8810;
4. Position size: Short positions should not exceed 15% in the short term. The downward trend in cyclical resources is clear this week, making short positions more cost-effective.
Key risk warnings:
Australian inflation continues to rise, the market restarts expectations of an RBA rate hike, putting pressure on banks and growth stocks;
Weakening Chinese manufacturing data leads to a decline in iron ore demand expectations, continuing to drag down heavyweights such as BHP and Rio Tinto;
Recurring tensions in the Middle East disrupt oil prices, increasing volatility in the energy sector;
US tech stocks continue to correct, transmitting downward pressure to the Australian information technology sector.
Dow Jones Industrial Average
Basic Market Overview:
TradingKey - OpenAI may postpone its initial public offering (IPO) until after next year, leading to market expectations of weaker demand for AI infrastructure and a sell-off in chip and memory stocks. All three major indices closed lower, with the Nasdaq Composite Index falling for the fifth consecutive day. At the close, the Dow Jones Industrial Average fell 0.09% to 51,876.11 points; the Nasdaq Composite Index fell 0.24% to 25,297.62 points; and the S&P 500 Index fell 0.05% to 7,354.02 points.
Tech giants are beginning to explore "reduced memory" strategies. Qualcomm highlighted its "High-Bandwidth Compute" architecture at an investor conference this week, aiming to reduce reliance on HBM in AI computing through a new system design. Previously, it was also reported that Nvidia is adjusting parts of the design of its next-generation Vera Rubin platform to reduce overall memory requirements. AI chip company Cerebras is highlighting "no HBM usage" as a core selling point. In its first earnings report since going public this week, the company stated that its wafer-level chips have completely broken free from HBM limitations.
Sector Performance:
Leading Stocks:
This Week's Leading Sectors + Dow Jones Component Leaders (Core Support for the Index)
1. Industrial Manufacturing (Strongest Sector This Week)
Logic: Falling oil prices, improved manufacturing order expectations, and a soft landing expectation for the economy benefit cyclical value stocks.
• Caterpillar (CAT): Leading the Dow Jones this week, with better-than-expected demand for construction machinery, a weekly gain of over 3.8%, and multiple single-day surges supporting the index.
• Honeywell (HON): Stable performance in aviation and industrial automation businesses, with a weekly gain of 2.1%.
• 3M (MMM), Boeing (BA): Oscillating upwards, with safe-haven funds flowing into military and materials sectors.
2. Financials (Banking/Insurance/Payment)
Logic: Delayed interest rate cut expectations, strong net interest margin resilience, and funds shifting from high-flying technology to undervalued financials.
• JPMorgan Chase (JPM): Weekly gain of 2.7%, leading US bank stock, supported by heavyweight stocks.
• Goldman Sachs (GS), Visa (V), American Express (AXP): All closed higher, with Traveller (TRV) also performing well. Synchronized Strength
3. Healthcare (Defensive and Hedging Sector)
Amid economic uncertainty, funds are allocating to defensive assets, with independent performance from tech stocks during corrections.
• UnitedHealth Group (UNH), Johnson & Johnson (JNJ), Merck (MRK), and Amgen (AMGN) all saw steady gains throughout the week, hedging against the decline in tech stocks and the overall index.
4. Energy (Oil & Gas)
Geopolitical conflicts supported oil prices, with Chevron (CVX) posting a slight gain, demonstrating strong resilience.
Leading Declines:
This week's leading declining sectors + Dow Jones component leaders (dragging down the index)
1. Information Technology / AI Technology (Biggest Drag This Week)
Market profit-taking on high-flying AI stocks, coupled with overvaluation and significant capital outflows, was the main reason for the Nasdaq's plunge. Tech components within the Dow Jones weakened across the board:
• Apple (AAPL): Plunged over 6% this week, its biggest weekly drop, with rising storage prices raising concerns about weakening consumer demand.
• Microsoft (MSFT), Amazon (AMZN): Weekly declines of 3%+, with cloud business growth falling short of expectations.
• Nvidia NVDA, Salesforce CRM, IBM, Cisco CSCO: Collective pullback, AI sector valuation digestion
2. Consumer Discretionary Goods
Consumer confidence weakens, retail and entertainment under pressure
• Home Depot HD, Disney DIS, Nike NKE continued to weaken this week
3. Telecommunications (Old Telecom)
Verizon VZ continued its weakness and will be replaced by Alphabet on June 29, with funds withdrawing in advance
Technical Analysis:
The Dow Jones Industrial Average rose 0.32% last week, consolidating in a narrow range of 51301–52248, with narrowing volatility and a divergent market at high levels; Key characteristics: Value/old economy supported the index, high-level AI technology stocks collectively pulled back, the Nasdaq fell sharply while the Dow was resilient, and funds continued to flow from technology to industrials, financials, and defensive healthcare sectors. The long-term upward channel remains intact, with the index firmly holding above the 20/50/200-week moving averages, indicating the main upward wave is unbroken. However, this week's small doji candlestick suggests a significant weakening of bullish momentum, indicating a period of high-level consolidation. The weekly RSI is in overbought territory at 72, showing signs of bearish divergence and suggesting a short-term pullback for correction. The Stochastic Oscillator has turned downwards from a high level, further indicating weakening bullish strength. Weekly trading volume has been moderately low, with rallies lacking volume, casting doubt on the sustainability of the upward trend. In the short term, the Dow Jones Industrial Average is currently consolidating at high levels, leaning towards a correction. Without increased capital inflows to break through 52286, a pullback to the 51370 support level is highly probable.
Trading Strategy:
Long Opportunities (Prioritizing Main Themes)
Long Opportunity: If the price holds above 51370 support and breaks through 52286 with increased volume, continue the upward trend with a target of 52800.
Short Opportunities (Only Consider Light Short Positions When Faced with Resistance at Higher Levels)
Short Opportunity: If the price fails to break through 52286, consider a pullback to 51370. A decisive break below this level could lead to a further drop to 50367.
Risk Warnings:
Hawky Fed CPI and non-farm payroll data delays interest rate cut expectations, suppressing growth stocks.
Recurring geopolitical conflicts in the Middle East push up oil prices, dampening risk appetite in the US stock market.
The Dow Jones Industrial Average component reshuffle on June 29 (Alphabet replacing VZ) will cause short-term volatility due to changes in index weighting.
The market is currently overbought at historical highs; a concentrated sell-off in tech stocks could trigger a rapid correction in the index.
Disclaimer: The information contained herein (1) is proprietary to BCR and/or its content providers; (2) may not be copied or distributed; (3) is not warranted to be accurate, complete or timely; and, (4) does not constitute advice or a recommendation by BCR or its content providers in respect of the investment in financial instruments. Neither BCR or its content providers are responsible for any damages or losses arising from any use of this information. Past performance is no guarantee of future results.
Lebih Liputan


Pendedahan Risiko:Instrumen derivatif diniagakan di luar bursa dengan margin, yang bermakna ia membawa tahap risiko yang tinggi dan terdapat kemungkinan anda boleh kehilangan seluruh pelaburan anda. Produk-produk ini tidak sesuai untuk semua pelabur. Pastikan anda memahami sepenuhnya risiko dan pertimbangkan dengan teliti keadaan kewangan dan pengalaman dagangan anda sebelum berdagang. Cari nasihat kewangan bebas jika perlu sebelum membuka akaun dengan BCR.
BCR Co Pty Ltd (No. Syarikat 1975046) ialah syarikat yang diperbadankan di bawah undang-undang British Virgin Islands, dengan pejabat berdaftar di Trident Chambers, Wickham’s Cay 1, Road Town, Tortola, British Virgin Islands, dan dilesenkan serta dikawal selia oleh Suruhanjaya Perkhidmatan Kewangan British Virgin Islands di bawah Lesen No. SIBA/L/19/1122.
Open Bridge Limited (No. Syarikat 16701394) ialah syarikat yang diperbadankan di bawah Akta Syarikat 2006 dan berdaftar di England dan Wales, dengan alamat berdaftar di Kemp House, 160 City Road, London, England, EC1V 2NX. Open Bridge Limited bertindak semata-mata sebagai pemproses pembayaran untuk BCR Co Pty Ltd dan tidak menyediakan sebarang perkhidmatan kewangan, perdagangan atau pelaburan bagi pihaknya. Peranan Open Bridge Limited adalah terhad kepada pemprosesan pembayaran.

 English
 简体中文
简体中文
 繁體中文
繁體中文
 Bahasa
Melayu
Bahasa
Melayu
 Tiếng
Việt
Tiếng
Việt
 ไทย
ไทย
 日本語
日本語
 한국어
한국어
 ភាសាខ្មែរ
 español

