


0
Currency & Commodity Analysis:
US Dollar Index
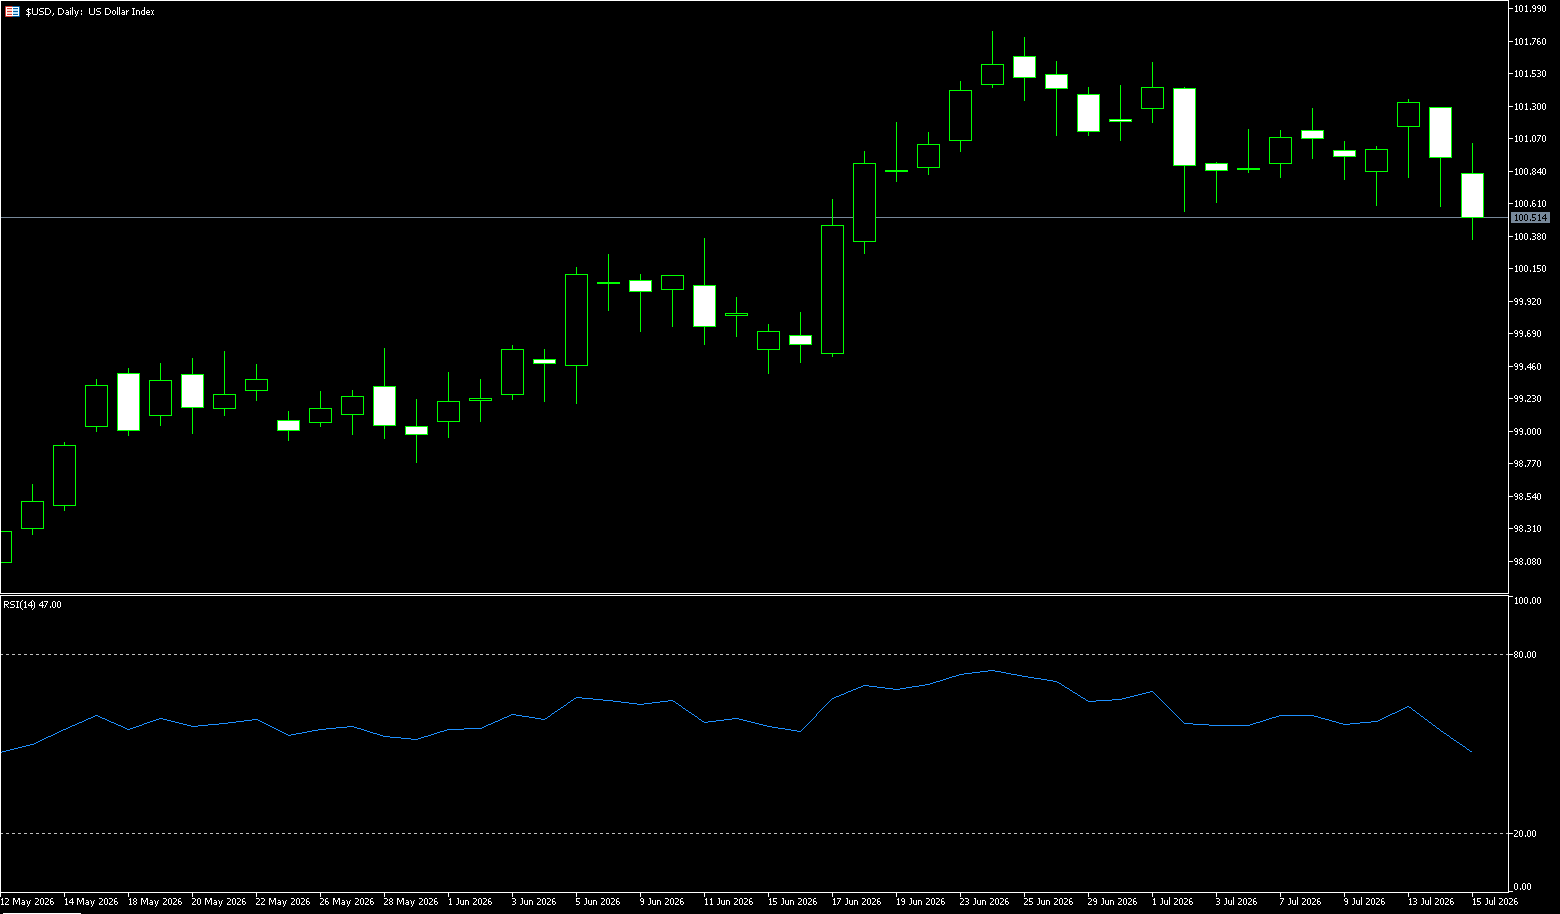
The US dollar index fell slightly to 100.36 on Wednesday as a weaker-than-expected producer price report provided new evidence of easing inflationary pressures. Producer prices unexpectedly fell 0.3% in June, compared to expectations of no change, while both the annual overall and core indicators were also lower than expected. This report followed Tuesday's weaker-than-expected consumer price index data, further reinforcing signs of slowing inflation. In addition, New York Fed President Williams stated that while inflation is "undoubtedly too high, there are encouraging reasons to expect that inflation has peaked." However, escalating hostilities in the Middle East and recent oil price increases still pose upside risks to the inflation outlook. Meanwhile, Fed Chairman Walsh reiterated the central bank's commitment to restoring price stability during his testimony before Congress. The market expects a 49% probability of a Federal Reserve rate hike in September, down from 70% last week.
The dollar weakened against major currencies this week as weaker-than-expected US June inflation data dampened market expectations for further Fed tightening. However, the market warns this easing sentiment may be short-lived, as escalating tensions between the US and Iran have pushed up oil prices, keeping the possibility of a rate hike later this year (the probability remains as high as 80%). On the other hand, geopolitically, escalating tensions between the US and Iran could increase the dollar's safe-haven appeal. The dollar fell to around 100.36 on Wednesday, so on the upside, watch the 101.10 (20-day simple moving average) and 101.57 (upper Bollinger Band on the daily chart) area; on the downside, watch 100.36 (Wednesday's low) and the 100.00 (psychological support level).
Today, consider shorting the US Dollar Index at 100.63, with a stop-loss at 100.75 and targets at 100.20 and 100.10.
WTI Crude Oil
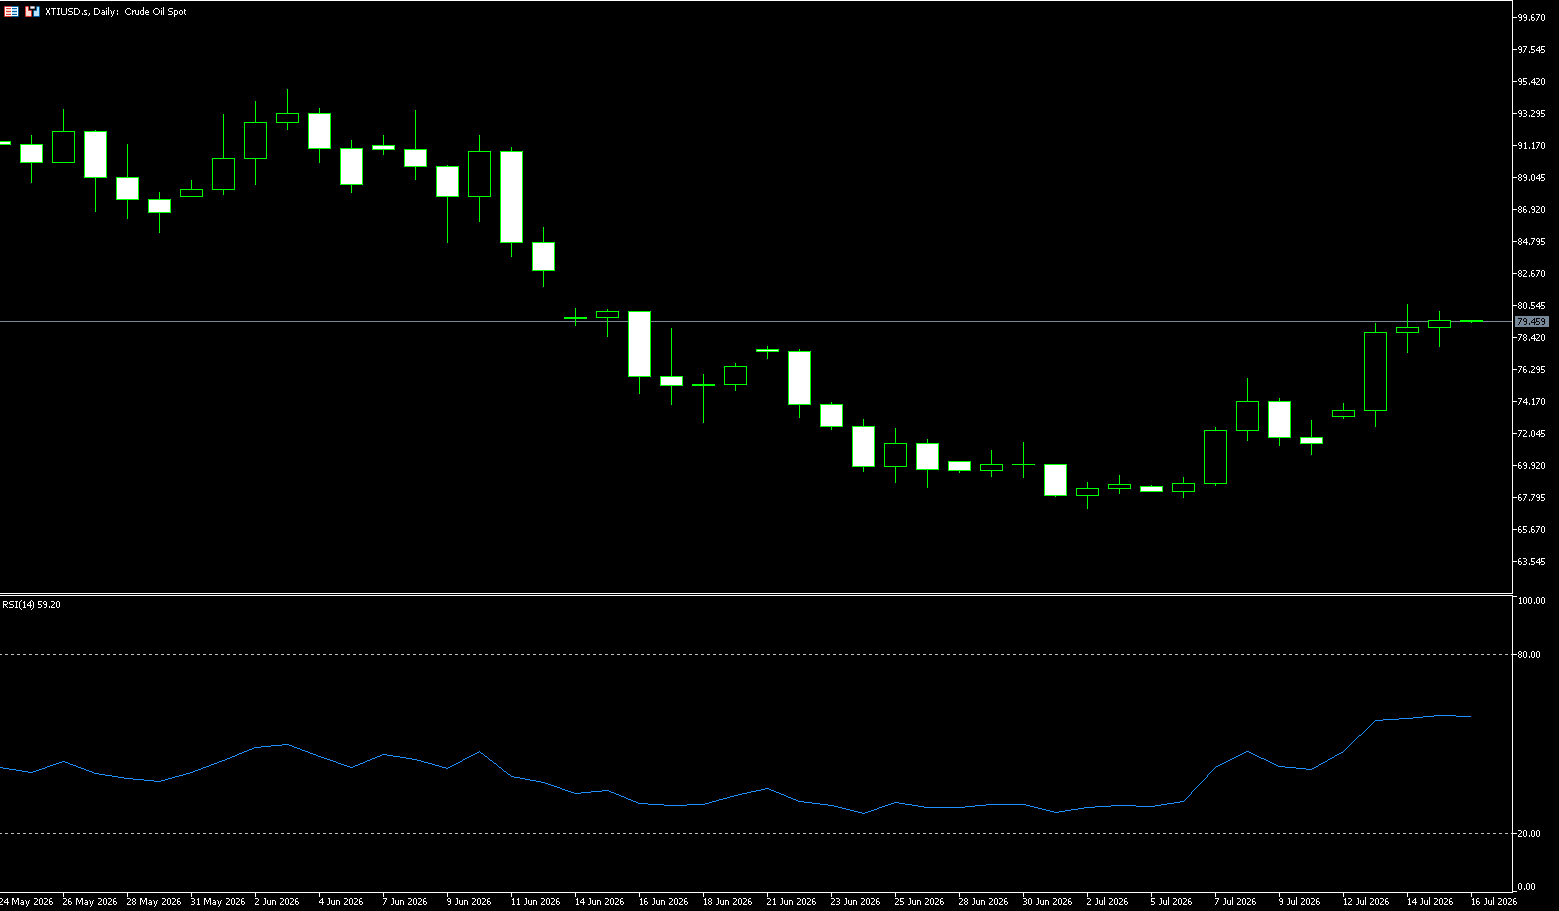
WTI crude oil is trading around $79.60 per barrel. It touched a one-month high of $80.60 per barrel on Tuesday, mainly due to the US reinstating its naval blockade against Iran and launching a new round of airstrikes. Iran's cruise missile strikes on two UAE oil tankers, resulting in casualties, sharply increased market concerns about the risk of disruption to the Strait of Hormuz, a vital supply route for approximately 20% of the world's oil. Despite the US reinstating its blockade against Iran, Trump's decision to lift tolls in the Strait of Hormuz limited oil price gains. Despite US President Trump's initial abandonment of the plan to impose a 20% escort fee and allow passage for ships other than Iranian vessels, the subsequent tanker attacks completely reversed the intraday decline. Meanwhile, the Ukrainian military's attack on two Russian refineries further exacerbated supply concerns. While the unexpectedly weaker-than-expected US June CPI reduced some bets on interest rate hikes, continued geopolitical conflicts pushed up oil prices and fueled inflation concerns. The market is currently reviewing EIA inventory data to assess the supply and demand dynamics.
The Strait of Hormuz has once again become blocked, posing a new round of supply shocks to the global energy market. WTI crude oil briefly broke through $87 per barrel, rising more than $12 from its early July lows, reflecting deep market concerns about a prolonged disruption to strait passage. With global crude oil inventories at historically low levels, any supply disruption could be amplified into dramatic price fluctuations. Whether the US and Iran can return to the negotiating table will determine the future trajectory of this global energy artery and whether the global economy can avoid a new round of inflationary shocks. Regarding support levels, Tuesday's low of $77.69 is a key short-term support. Holding this level is crucial for oil prices to maintain the $80.00 psychological level and the $80.61 area (Tuesday's high), followed by above $85.75 (December 6th high). A break below this level would target the 5-day moving average at $75.90, which would be the next target if the situation truly eases, with the next level at $75.00.
Today, consider going long on crude oil at $79.60, with a stop-loss at $79.40 and targets at $81.80 and $82.50.
Spot Gold
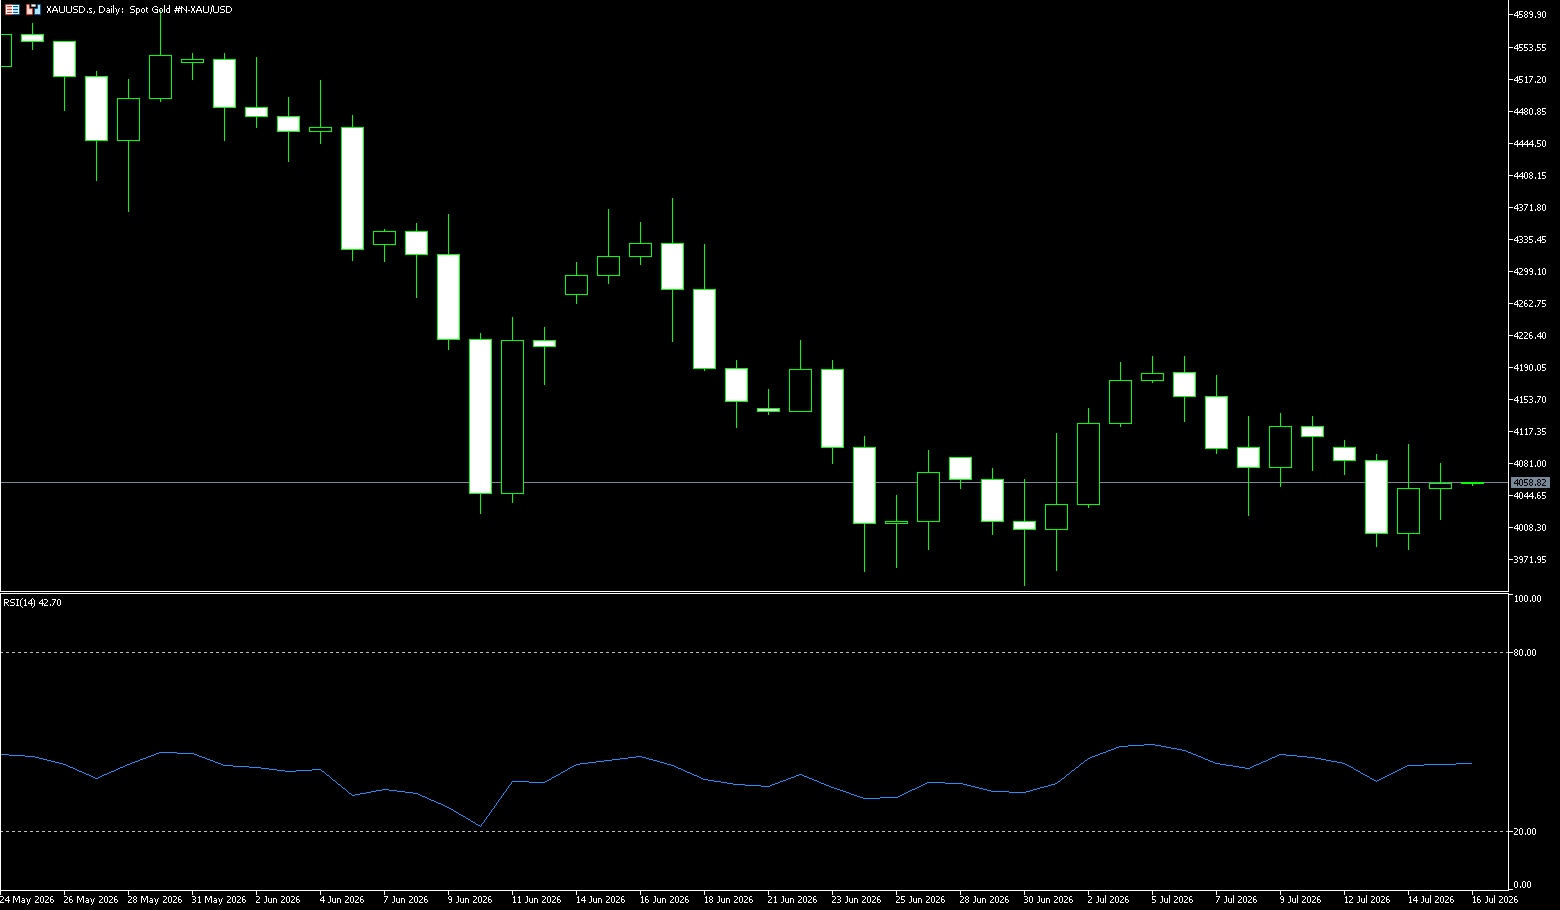
On Wednesday, spot gold traded around $4,060 per ounce. Gold prices rebounded more than 1% on Tuesday as weaker-than-expected US June inflation data reduced market bets on a July rate hike by the Federal Reserve, leading to a weaker dollar and boosting gold prices. A clash between escalating inflation and rising tensions sent gold prices volatile between $3,980 and $4,100 before settling near $4,050. Unexpectedly weak US June CPI figures sharply reduced expectations of an interest rate hike, weakening the dollar and directly boosting gold prices. However, the escalating US-Iran conflict pushed up oil prices, exacerbating uncertainty about the inflation outlook. With these two conflicting factors intertwined, the $4,000 level became the core battleground between bulls and bears, highlighting gold's role as the ultimate hedge against uncertainty. Weak inflation data directly pressured the dollar exchange rate. The dollar index closed at 100.93 on Tuesday, down 0.37%. The weakening dollar made dollar-denominated gold cheaper for holders of other currencies, providing direct monetary support for the gold price rebound.
On the daily chart, gold prices remain under pressure, continuing to trade below the 20-day simple moving average (SMA) at $4,091, while the 34-day and 50-day SMAs are at highs of $4,193 and $4,319 respectively, reinforcing the dominant bearish backdrop. Technical indicators point upwards, but momentum indicators remain neutral, and the RSI is still below the midline, reflecting the previous rapid rise rather than indicating further gains. On the downside, initial support lies at the psychological level of around $4,000 and the $3,983 area (Tuesday's low). A break below this level would expose $3,941.70 (the low at the end of June), followed by the $3,900 psychological level. On the upside, the 20-day SMA is at $4,091, with a further target of $4,138 (the 25-day SMA).
Today, consider going long on gold at 4.055, with a stop-loss at 4.050 and targets at 4.100.
AUD/USD
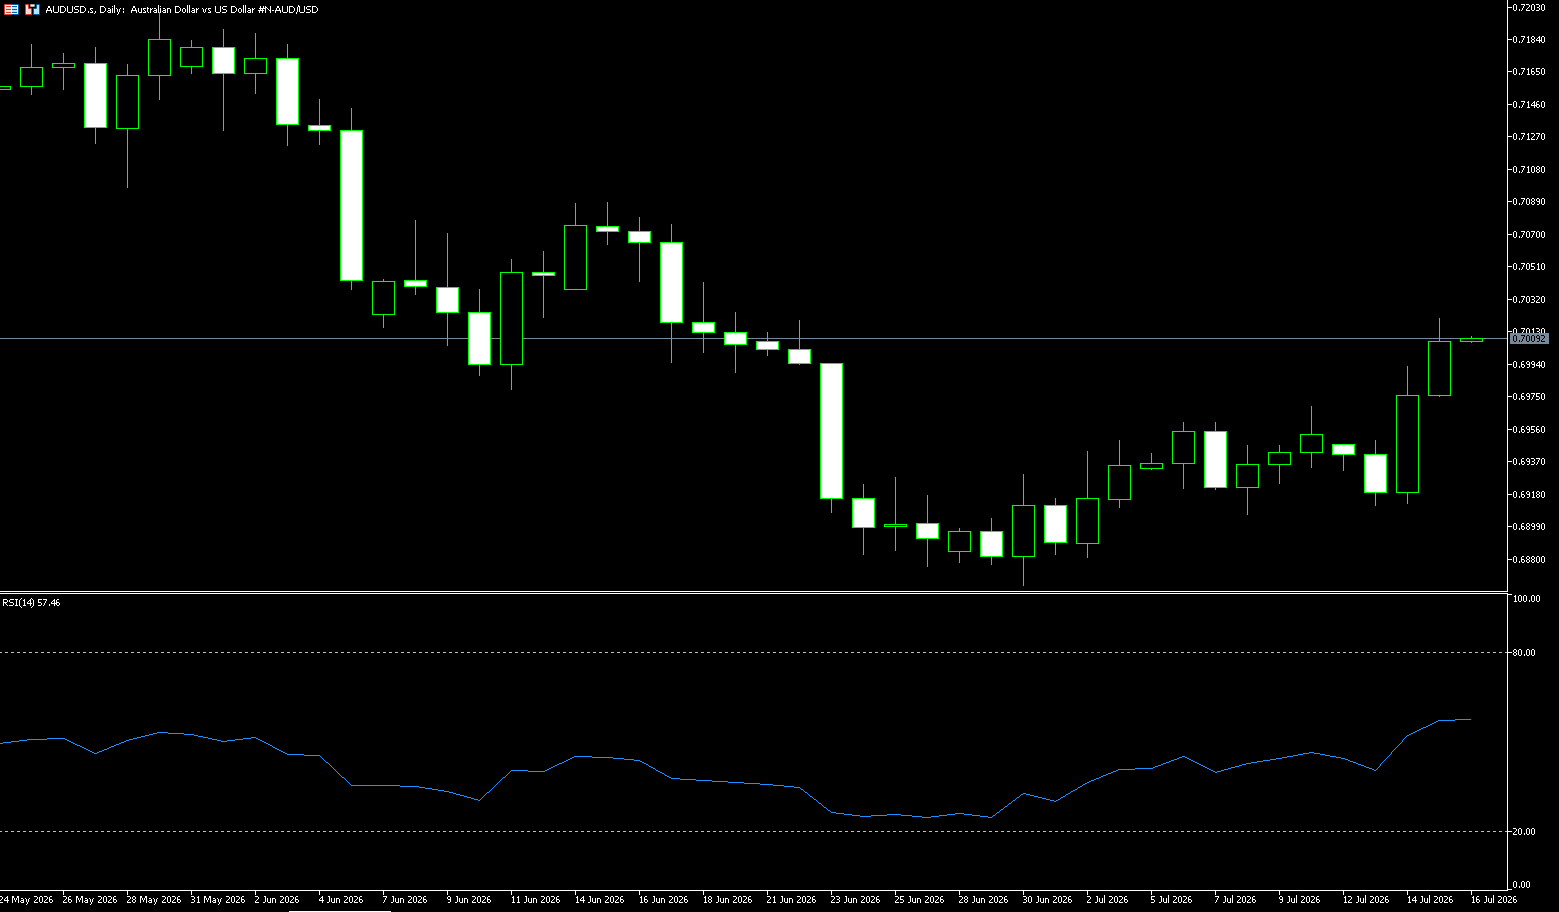
The Australian dollar appreciated to around US$0.7021, reaching its highest level in three weeks, as weaker-than-expected US inflation data pressured the dollar and reduced market expectations for further Fed rate hikes. Investors also disregarded renewed tensions between the US and Iran after President Trump threatened additional strikes and a reinstatement of the US blockade of Tehran, focusing instead on Washington's decision to abandon proposed tariffs on goods transiting the Strait of Hormuz, which improved risk sentiment. In Australia, expectations for further policy tightening remain subdued following the Reserve Bank's three rate hikes since February. The market currently only prices a 20% probability of a rate hike in August and around a 60% probability by December. Meanwhile, recent business surveys showed that operating conditions remained weak in June, with cost pressures easing somewhat, while consumer confidence improved slightly in July, despite challenges from rising fuel prices.
On the daily chart, the Australian dollar is trading above 0.7000 against the US dollar, continuing to lie below the 50-day moving average at 0.7057 and the 100-day simple moving average at 0.7063. While the 200-day simple moving average at 0.6876 provides support, it is limiting the pair's upside in the short term. The 14-day Relative Strength Index (RSI) is at 51.40, remaining largely neutral, while the Average Directional Index (ADX) at around 31 indicates a moderate overall trend, but the latest rally lacks strong momentum to challenge the cluster of moving averages above. On the upside, initial resistance lies at the 50-day moving average at 0.7057 and the 100-day simple moving average at 0.7063, forming a dense resistance zone slightly above the current price; higher resistance is seen at the psychological level of 0.7100. On the downside, if the US-Iran conflict continues to escalate, further deterioration in risk appetite could push the Australian dollar to test the 0.6900 or even the 0.6876 (200-day moving average) area.
Consider going long on the Australian dollar at 0.6990 today, with a stop loss at 0.6980 and targets at 0.7030 and 0.7040.
GBP/USD
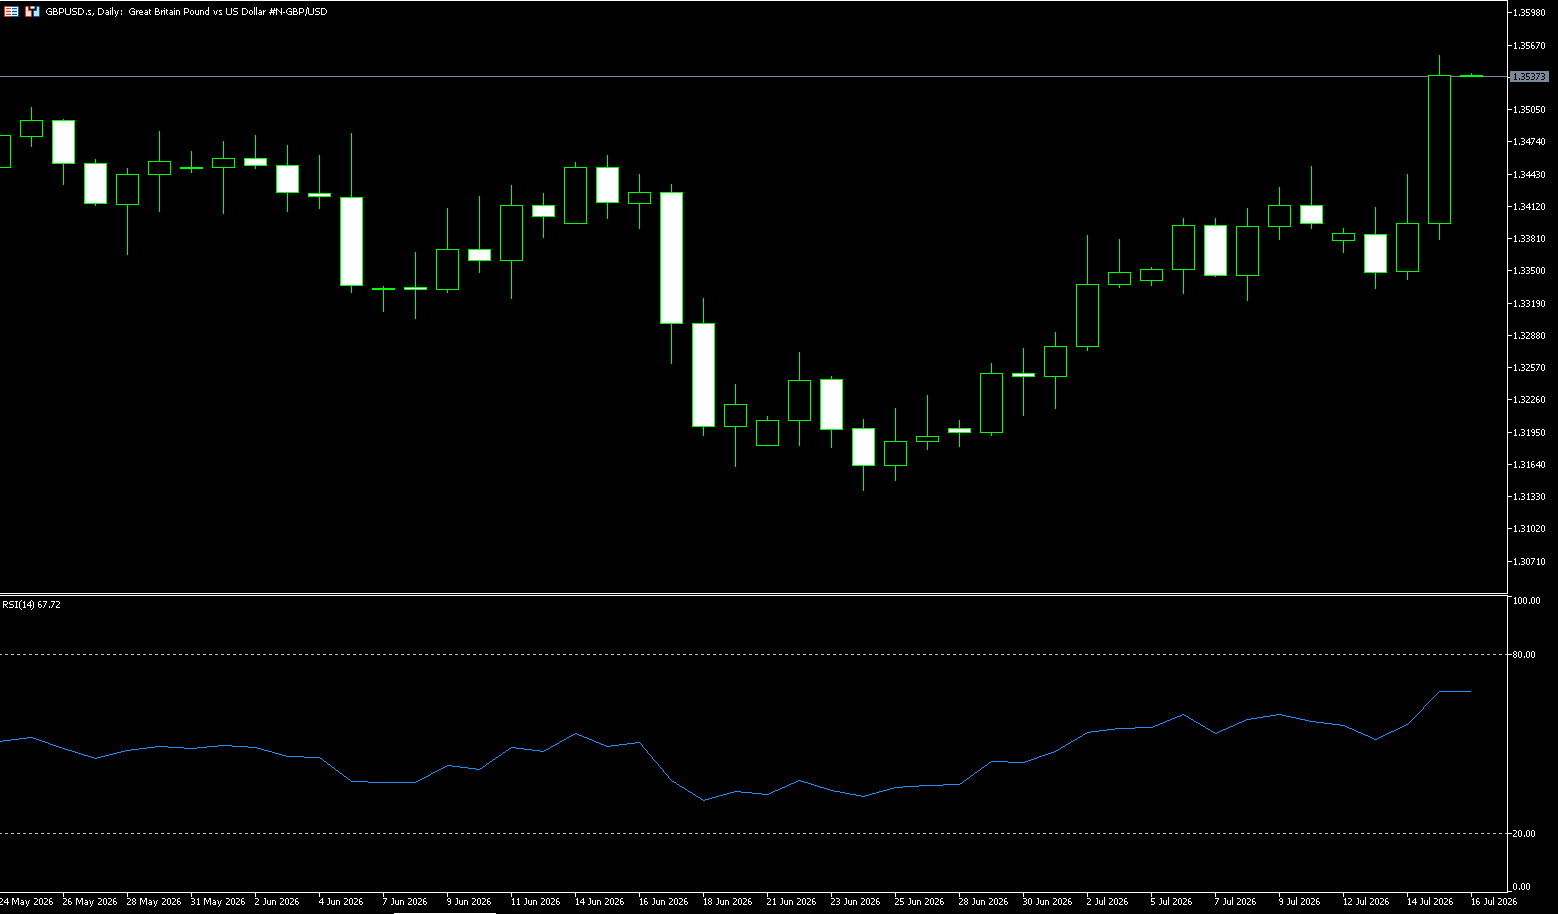
The pound rose to $1.3558, its highest level since the end of May, and also reached its highest level against the euro in over a year, mainly due to market expectations that Andy Burnham will be confirmed as the next British Prime Minister on Monday and will appoint a conservative Chancellor of the Exchequer. With Burnham's confirmation essentially a done deal, investor attention has shifted to his choice of Treasury Secretary, particularly given the backdrop of Britain's fragile public finances. Reports that Home Secretary Shabana Mahmoud is the leading candidate for Treasury Secretary helped restore market confidence and eased concerns that Burnham might appoint Ed Miliband, who is seen as favoring a more expansionary fiscal policy. Meanwhile, escalating tensions in the Middle East pushed oil prices to their highest level in a month, further reinforcing market expectations of a Bank of England interest rate hike. The market now fully anticipates a rate hike in November and expects another hike by March 2027.
GBP/USD is trading at 1.3530. The pair broke through the downtrend resistance line from the May high but remains capped below the 1.3600 level. Momentum indicators on the daily chart are neutral to bullish, with the 14-day Relative Strength Index (RSI) hovering above 65 and the Moving Average Convergence Divergence (MACD) in positive territory. However, the aforementioned psychological level around 1.3600 may prove difficult to break. A break above this level would target the May high around 1.3653. On the downside, 1.3500 could pose a challenge for bears. Further down, the 300-day simple moving average at 1.3431 will be the next target.
Today, consider going long on GBP at 1.3520, with a stop-loss at 1.3510 and targets at 1.3570 and 1.3580.
USD/JPY
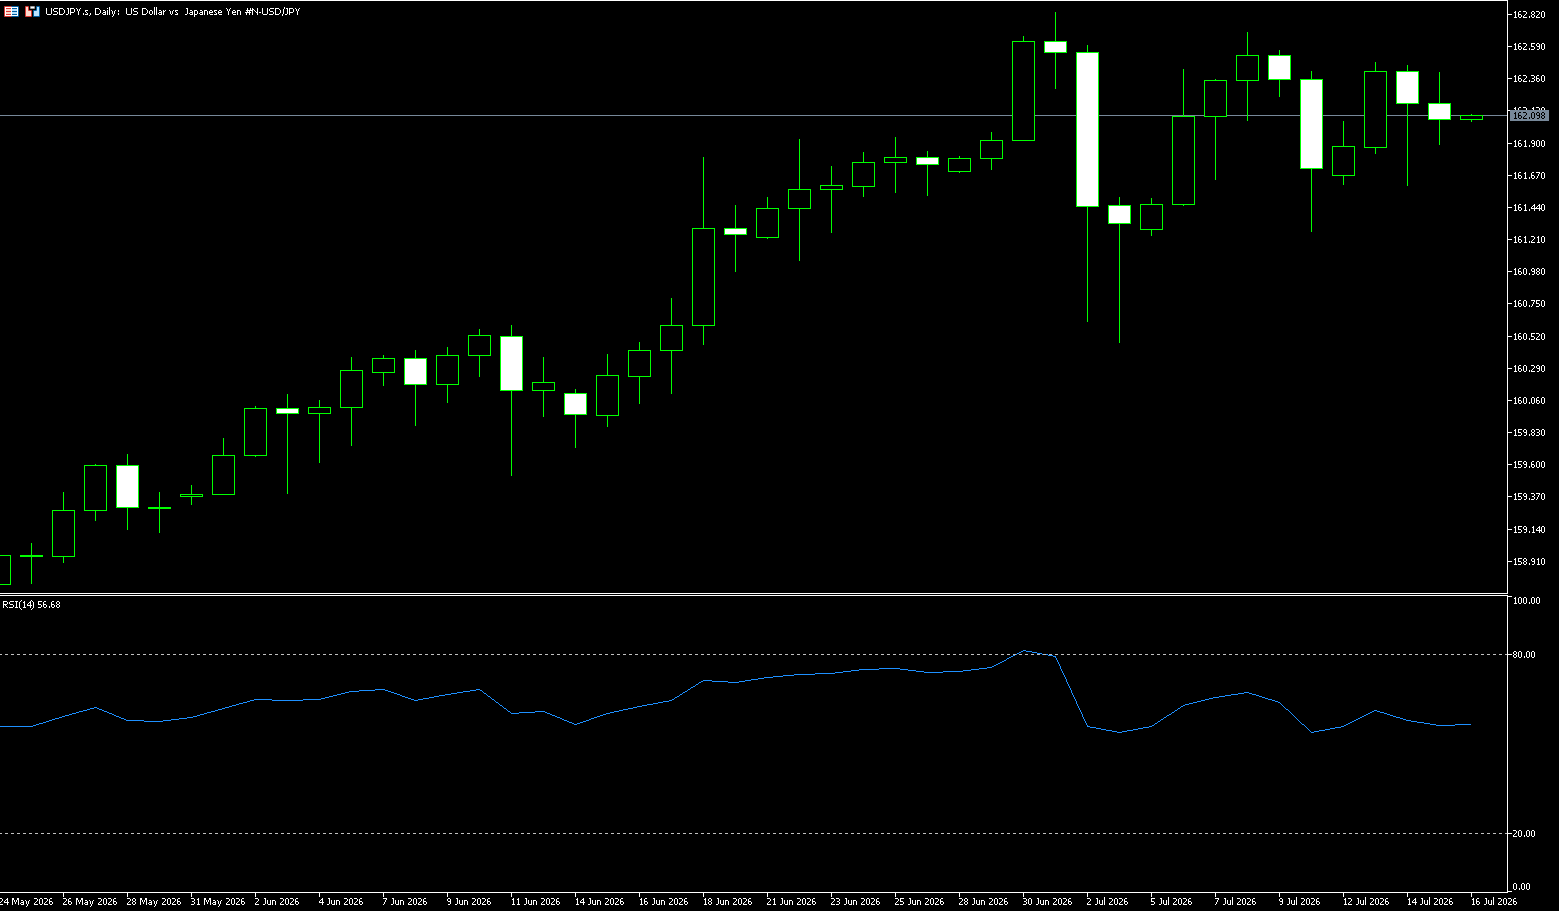
The yen stabilized at around 162 yen per dollar on Wednesday, supported by a weaker dollar after weaker-than-expected US inflation data eased concerns about an imminent Fed rate hike. However, the outlook remains weighed on by rising geopolitical tensions in the Middle East, with oil prices rising after President Trump threatened additional strikes against Iran and reinstated a US blockade of Tehran in the Strait of Hormuz. In Japan, data showed a larger-than-expected decline in machinery orders in May, highlighting broad-based weakness in business investment. Despite a modest rebound, the yen remains near 40-year lows as Tokyo lacks concrete measures to bolster the currency. A recent report also noted that Japan has no immediate plans to adjust the asset allocation of its national pension fund, reducing expectations for short-term support for domestic assets.
From a technical perspective, spot prices remain capped by two converging trend lines, forming a symmetrical triangle on the 4-hour chart. Given the strong rebound since the May monthly swing low, this triangle pattern could be categorized as a bullish consolidation phase before the next upward move. Furthermore, the earlier-month corrective pullback showed resilience below the 200-period exponential moving average (200-period moving average) at 161.10 on the 4-hour chart. Meanwhile, momentum indicators are relatively flat. In fact, the Relative Strength Index (RSI) is hovering near neutral 51, and the MACD is slightly positive near the zero line, suggesting a cautious upward tone rather than an impulsive rally. Therefore, it would be prudent to wait cautiously for a breakout of the triangle resistance level (around 162.55-162.60) before further appreciation in USD/JPY. The next level to watch is the psychological level of 163.00. On the downside, the 200-period exponential moving average at 161.10 on the 4-hour chart forms initial intraday support, followed by the 161 level.
Today, consider shorting the US dollar at 162.30, with a stop loss at 162.50 and targets at 161.70 and 161.60.
EUR/USD
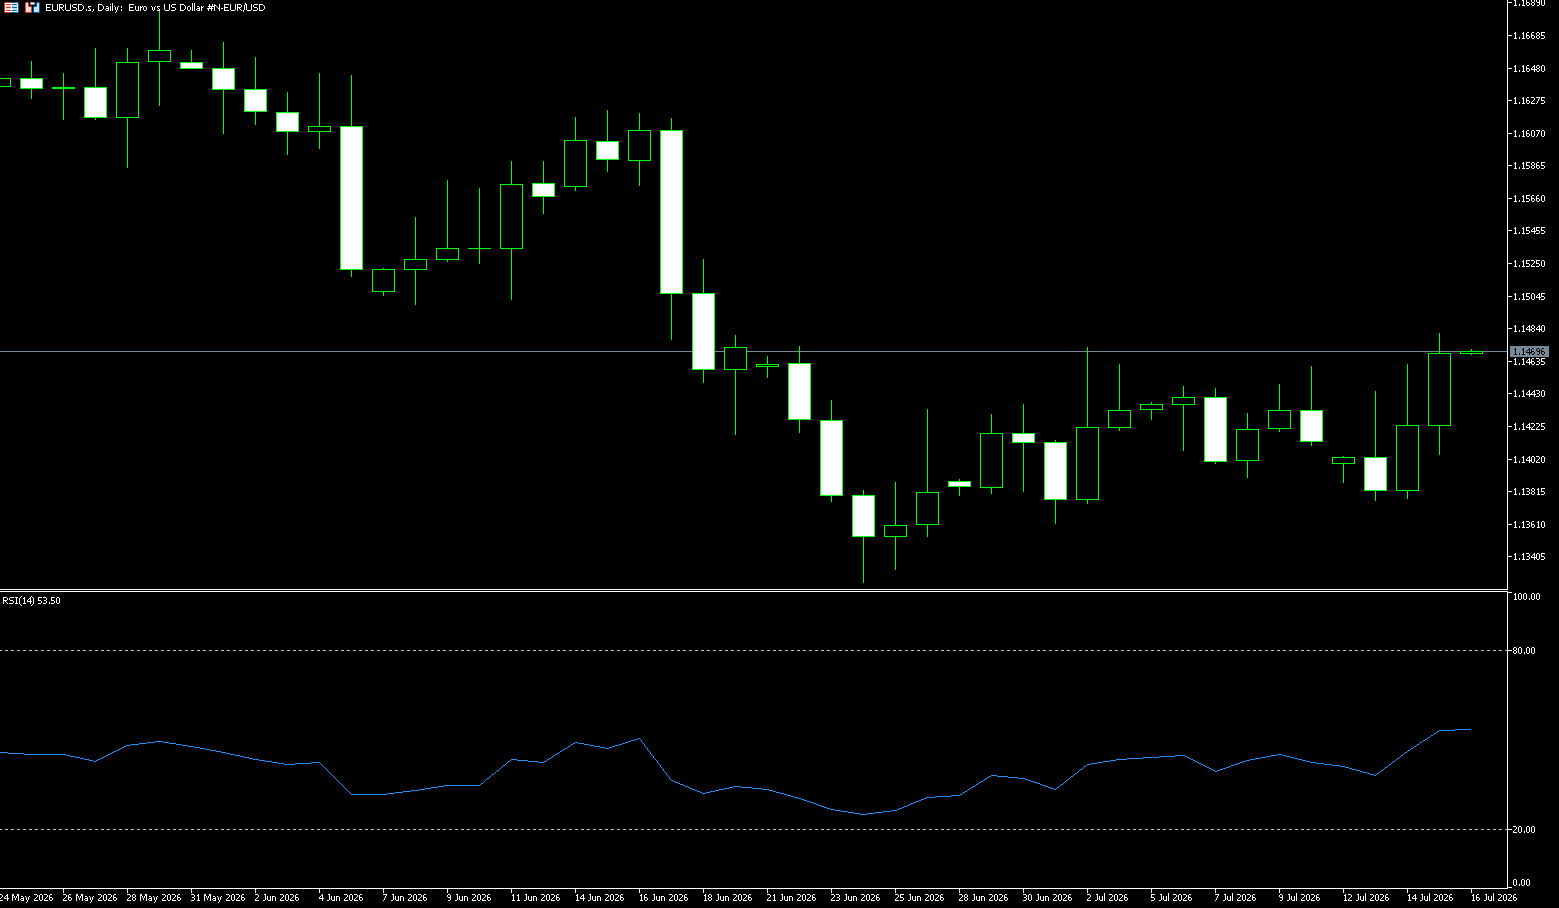
On Wednesday, the euro/dollar rose to near 1.1460. The dollar weakened against the euro due to weaker-than-expected US inflation data, temporarily easing pressure on the Federal Reserve. According to data released Tuesday by the US Bureau of Labor Statistics (BLS), the US Consumer Price Index (CPI) showed that inflation fell to 3.5% year-on-year in June, down from a three-year high of 4.2% in May. This figure was lower than the market expectation of 3.8%. On a monthly basis, the overall CPI fell by 0.4% in June, compared to a 0.5% increase in May. Federal Reserve Chairman Kevin Warsh said on Tuesday that the slowdown in June inflation does not mean the mission is accomplished. On Monday, Federal Reserve Governor Christopher Waller said that if data shows inflation consistently well above the central bank's 2% target, interest rates may need to be raised "in the near future." In Europe, soaring oil prices reignited inflation concerns, and traders increased their bets on the European Central Bank accelerating its rate hikes. According to Bloomberg, the market expects the European Central Bank to raise interest rates by 25 basis points in September, with another rate hike almost certain before the end of the year.
The euro/dollar pair ended a lackluster week, remaining largely unchanged and slightly above the 1.1450 level. The euro/dollar traded around 1.1420, maintaining a short-term bearish pattern as spot prices remained below 1.1500 and broke below a bearish flag pattern. The Relative Strength Index (RSI) hovered around 50, suggesting continued but not extreme downward momentum. On the upside, initial resistance lies at the psychological level of 1.1500, followed by the 50-day moving average at 1.1542. Key support lies at 1.1400 (the psychological level); then the June 24 low of 1.1324, followed by the 1.1300 level.
Today, consider going long on the Euro at 1.1453, with a stop-loss at 1.1440 and targets at 1.1520 and 1.1530.
Stock Analysis:
Australian ASX 200 Stock Index
Basic Market Overview:
The Australian Securities Exchange (ASX) 200 index rose 33 points, or 0.4%, to close at 8,841 on Wednesday, its strongest close of the week. Market sentiment improved after two lackluster trading days as weaker-than-expected US inflation data eased pressure for interest rate hikes. Meanwhile, China's second-quarter annualized GDP growth rate, the lowest since 2022, boosted expectations for new stimulus measures from Australia's major trading partners, with officials warning of persistently high external risks and demand lagging behind supply. However, gains were limited by caution regarding next week's domestic labor market data. Electronics, business services, and manufacturing led the gains, while logistics, healthcare, and non-durable consumer goods declined.
Heavyweight stocks performed well: BHP Billiton rose 3.4% ahead of Thursday's production update, Rio Tinto rose 1.2% after exceeding iron ore sales expectations, and Macquarie rose 1.6% to a record high. In contrast, energy stocks retreated, with Woods Energy down 1%, Santos down 0.7%, and Whitehaven Coal down 0.3%.
Sector Performance:
Leading Sectors
1. Materials (XMJ) +1.70% [Strongest Performer]
Catalysts: Stronger iron ore and copper prices; anticipated BHP worker strike disrupting port shipments; supply concerns due to severe weather at Chilean copper mines.
Key Stocks:
◦ BHP +3.2%
◦ Rio Tinto +1.1%
◦ Capstone Copper +4.6%
2. Financials (XFJ) Slightly Stronger
Macquarie Bank (MQG) hit a record high (+1.6%), with major banks generally closing modestly higher.
Leading Sectors
1. Energy (Energy XEJ) -0.87% [Weakest of the Market] Slight weakness in international crude oil prices weighed on oil and gas stocks.
◦ Woodside Energy (WDS) -1.0%
◦ Santos (STO) -0.7%
2. Healthcare (Health Care XHJ) Weak Defensive sectors saw capital outflows, with CSL and COCH cochlear implants continuing to face pressure.
Technical Analysis:
The ASX 200 index closed at 8,841 points, up 0.36%. Overnight, US inflation data cooled, risk sentiment improved, and the mining sector led the gains. However, market trading volume was weak, with fewer stocks rising than falling, and the rebound lacked broad-based capital resonance. The ASX 200 index is currently at a critical crossroads. From the daily chart, the index experienced some profit-taking pressure after reaching near historical highs, and the short-term moving average system is showing signs of convergence. The key support level is currently around 8,100 points, a previous area of dense trading. If the market can stabilize at this level, the bullish structure remains valid. However, a break below this support could lead to a further decline towards the 50-day moving average support around 7,950 points. Resistance analysis: The upper resistance is concentrated at the 8,300 point level. This is a strong resistance zone in the short term, where significant selling pressure has accumulated. If trading volume cannot sustain a breakout, a period of high-level consolidation is likely. Technical indicators: The RSI (Relative Strength Index) is in the neutral range, indicating a lack of clear unilateral driving force in the market. The MACD indicator shows a narrowing of the momentum bars, suggesting a weakening of upward momentum in the short term.
Trading Strategies:
The following are technical trading ideas only and do not constitute investment advice. Leveraged trading may result in losses exceeding the principal.
Short-Term Trading Strategies (Suitable for intraday/3-5 day swings)
Option 1: Bullish Strategy (Trend-following rebound, cautiously long)
Entry Conditions: Retracement to the 8800-8810 range and stabilization.
Stop Loss: A decisive break below 8790 (closing price/4-hour candlestick chart below this level).
First Target: 8860; Second Target: 8880
Risk Management: Reduce position by half upon reaching 8860, and use a trailing stop loss to protect profits; if the price rises to around 8875 and fails to break through, proactively take profits and exit the position; do not chase the price higher.
Option 2: Bearish Strategy (Playing for a pullback at the upper edge of the trading range)
Entry Conditions: Rebound to 8870-8880 and encountering resistance; 4-hour candlestick chart showing stagnation.
Stop Loss: A move above 8910. Above
First Target: 8820; Second Target: 8800 (Key Support)
Key Risk Warnings:
The ASX200 is highly correlated with the mining and banking sectors, making it extremely vulnerable to sudden fluctuations in commodity prices;
Range-bound trading is prone to false breakouts; avoid heavy positions and holding losing trades;
External Risks: Changes in US-China macroeconomic expectations, China's real estate stimulus policies, and significant fluctuations in overseas stock markets can all rapidly alter the market trend.
China Shanghai Composite Index
Basic Market Overview:
On Wednesday, the Shanghai Composite Index rose 0.2% to 3974 points, while the Shenzhen Component Index fell 0.3% to 14891 points, as investors weighed signs of an uneven recovery in the Chinese economy. Second-quarter GDP growth slowed to 4.3%, down from 5.0% in the first quarter and below market expectations of 4.5%. This is the weakest expansion since the fourth quarter of 2022, below the government's 2026 target range of 4.5%–5.0%. Furthermore, fixed asset investment fell 5.7% year-on-year in the first half of the year, worse than the expected 4.9% decline and the 4.1% decline recorded from January to May.
On the positive side, industrial production accelerated to a three-month high of 5.3% in June, while retail sales unexpectedly rebounded to 1%. Additionally, the urban unemployment rate fell to a one-year low of 5.0%. Financial stocks underperformed, with Industrial and Commercial Bank of China (ICBC) falling 0.9%, Agricultural Bank of China (ABC) falling 1.3%, and China Construction Bank (CCB) falling 1.9%.
Sector Performance:
Top Gaining Sectors (Top 3 Gainers)
Beauty & Personal Care: Capital seeking refuge, valuation repair, and expectations of consumption recovery. Aimeike (+7.8%), Huaxi Bio (+6.9%)
Media: Expectations of summer movie season for cinemas, valuation repair in the gaming sector. Wanda Film (+9.2%), Enlight Media (+8.5%), 37 Interactive Entertainment (+6.1%)
Food & Beverage: Baijiu (Chinese liquor) sector led the gains. Positive interim results and expectations of consumption stimulus policies. Kweichow Moutai (+5.8%), Wuliangye (+6.2%), Luzhou Laojiao (+5.9%)
Top Losing Sectors (Top 3 Losers)
Electronics: Profit-taking at high levels, negative news for memory chips, and semiconductor cycle adjustment. Demingli (limit down), Jiangbolong (-9.8%), Cambricon (-8.7%)
Non-Ferrous Metals: Concerns about industrial metal demand, and a price correction in new energy metals. Ganfeng Lithium (-4.2%), Tianqi Lithium (-3.9%), Huayou Cobalt (-3.7%)
Telecommunications: Capital outflow from computing power sector, cooling expectations for 5G infrastructure, ZTE (-3.1%)
Technical Analysis:
The Shanghai Composite Index closed at 3,955.58 points, down slightly by 0.29%; the market showed strong divergence, with funds shifting from high-flying technology sectors to low-flying defensive consumer and pharmaceutical sectors. Beauty and personal care, media, and food and beverage led the gains, while electronics, non-ferrous metals, and telecommunications led the declines. Daily chart pattern: The market rallied before pulling back, closing with a small bearish candlestick with a long upper shadow. The highest point was 3,981.67, and the lowest was 3,943.70. Trading volume was 1,226.298 billion yuan, a decrease of approximately 3.58% compared to the previous day. Technical indicators: MACD: The daily red bars are shortening, indicating a risk of a death cross and weakening short-term momentum. RSI: It has retreated from around 60, remaining in the neutral range and not yet overbought or oversold. In terms of volume, the pullback was accompanied by reduced volume, indicating increased investor caution and insufficient upward momentum. The Shanghai Composite Index is expected to fluctuate between 3,930 and 3,980 points. A break below 3,930 support could lead to a further decline to around 3,900 points. A break above 3,980 with increased volume could potentially push towards the 4,000-point mark. It is recommended to continue focusing on defensive sectors and wait for market stabilization signals before considering adding to positions.
Trading Strategy:
The index is likely to oscillate and retrace (higher probability scenario).
Trading Ideas:
1. If the index retraces to around 3934 and stabilizes without making new lows, and northbound capital flows are not continuously large-scale outflows, consider buying in small positions to speculate on a recovery.
2. Keep your position size to 40-50%; do not heavily bet on a rebound.
3. The initial target is the 3965-3975 resistance zone; take profits in batches upon reaching this level.
If the index breaks below 3920 with high volume during the retracement, do not rush to buy the dip; wait for a second confirmation.
Trading Ideas:
1. If the price rallies but trading volume is insufficient and northbound capital inflows are weak, reduce positions on rallies and realize short-term profits.
2. Only if the price rallies and stabilizes above 3975 with high volume can you maintain a core position to observe whether it can challenge the 4000 level.
3. If the price rallies and then falls back, breaking below the opening low, reduce short-term positions for defensive purposes.
Risk Warning:
Do not chase rallies without volume; do not panic and sell at a loss during sharp drops;
3934 is the key support level to watch today, and 3965 is the first resistance level;
Strictly control your total position size in volatile markets; do not use full leverage to speculate on single-day market movements;
Do not be greedy for short-term profits; take profits in batches when the price reaches the preset resistance level.
Disclaimer: The information contained herein (1) is proprietary to BCR and/or its content providers; (2) may not be copied or distributed; (3) is not warranted to be accurate, complete or timely; and, (4) does not constitute advice or a recommendation by BCR or its content providers in respect of the investment in financial instruments. Neither BCR or its content providers are responsible for any damages or losses arising from any use of this information. Past performance is no guarantee of future results.
Lebih Liputan





Pendedahan Risiko:Instrumen derivatif diniagakan di luar bursa dengan margin, yang bermakna ia membawa tahap risiko yang tinggi dan terdapat kemungkinan anda boleh kehilangan seluruh pelaburan anda. Produk-produk ini tidak sesuai untuk semua pelabur. Pastikan anda memahami sepenuhnya risiko dan pertimbangkan dengan teliti keadaan kewangan dan pengalaman dagangan anda sebelum berdagang. Cari nasihat kewangan bebas jika perlu sebelum membuka akaun dengan BCR.
BCR Co Pty Ltd (No. Syarikat 1975046) ialah syarikat yang diperbadankan di bawah undang-undang British Virgin Islands, dengan pejabat berdaftar di Trident Chambers, Wickham’s Cay 1, Road Town, Tortola, British Virgin Islands, dan dilesenkan serta dikawal selia oleh Suruhanjaya Perkhidmatan Kewangan British Virgin Islands di bawah Lesen No. SIBA/L/19/1122.
Open Bridge Limited (No. Syarikat 16701394) ialah syarikat yang diperbadankan di bawah Akta Syarikat 2006 dan berdaftar di England dan Wales, dengan alamat berdaftar di Kemp House, 160 City Road, London, England, EC1V 2NX. Open Bridge Limited bertindak semata-mata sebagai pemproses pembayaran untuk BCR Co Pty Ltd dan tidak menyediakan sebarang perkhidmatan kewangan, perdagangan atau pelaburan bagi pihaknya. Peranan Open Bridge Limited adalah terhad kepada pemprosesan pembayaran.


 English
 简体中文
简体中文
 繁體中文
繁體中文
 Bahasa
Melayu
Bahasa
Melayu
 Tiếng
Việt
Tiếng
Việt
 ไทย
ไทย
 日本語
日本語
 한국어
한국어
 ភាសាខ្មែរ
 español