


0
US Dollar Index
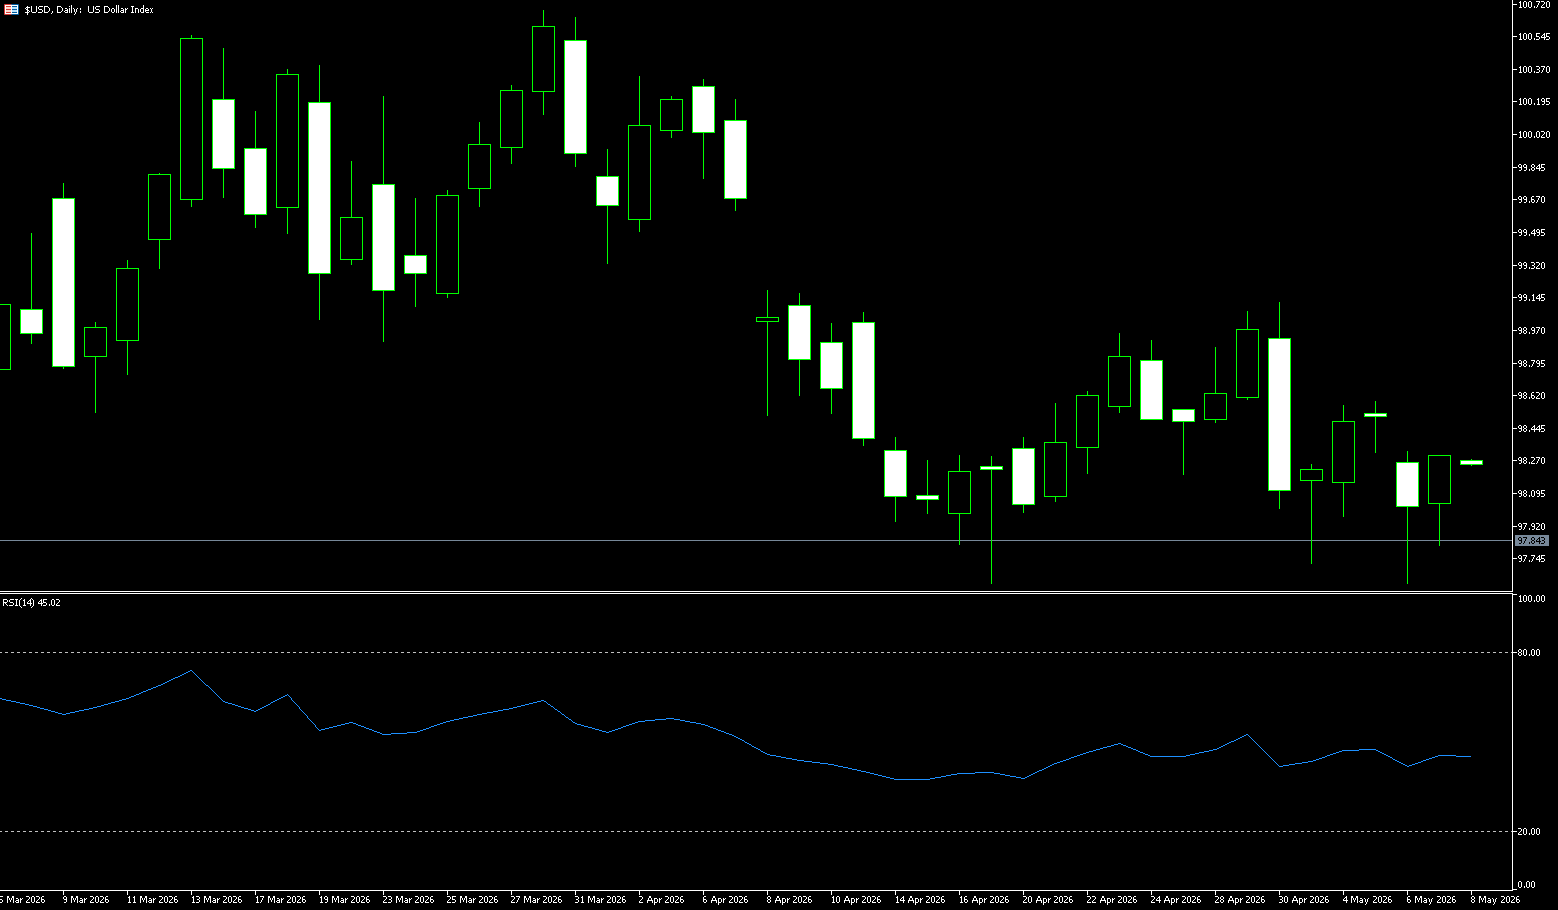
The US dollar index held above 98 on Wednesday, rising after stronger-than-expected US inflation data reduced market expectations for a Federal Reserve rate cut. US consumer inflation rose 3.8% in April, higher than the expected 3.7% and the highest level since May 2023, as soaring energy prices linked to the Middle East conflict exacerbated price pressures. The market has essentially eliminated expectations of a Fed rate cut this year, while expectations for a 25 basis point rate hike in December have risen to 35%. Investors are now focused on the latest producer inflation report for further signals on how the Iran war will affect the US economy. Meanwhile, inflation risks remain high as diplomatic efforts to resolve the US-Iran conflict stall and oil prices remain high. President Trump will also meet with Chinese President Xi Jinping this week, although he has stated that trade negotiations will take priority over the Iran situation.
The market has completely shifted to a bearish stance on the dollar, downgrading the dollar index position from neutral-to-bearish to "fully bearish," targeting a drop to 95 in the coming months. The bank characterized the expected decline as cyclical rather than structural, with limited magnitude and duration. The US dollar index traded around 98.32, up slightly for the day. It reached a high of 98.37 and a low of 98.26, with a range of only 0.1%, indicating a typical narrow-range trading pattern where bulls and bears have temporarily reached a balance at key levels. The current price of 98.52 (the 200-day moving average) has now become near-term resistance. This means that bears still hold a technical advantage in the short term. However, the price has not strayed far from the moving average system and is not far from the 100-day moving average (98.46) and the 200-day moving average (98.52), suggesting potential for a rebound if positive catalysts emerge. The 99 level forms a key medium-term resistance; while the previous low of 98.00 (a psychological level) and the 97.62 area (last week's low) provide strong support.
Consider shorting the US Dollar Index today at 98.58, with a stop-loss at 98.70 and targets at 98.100 and 98.00.
WTI Crude Oil
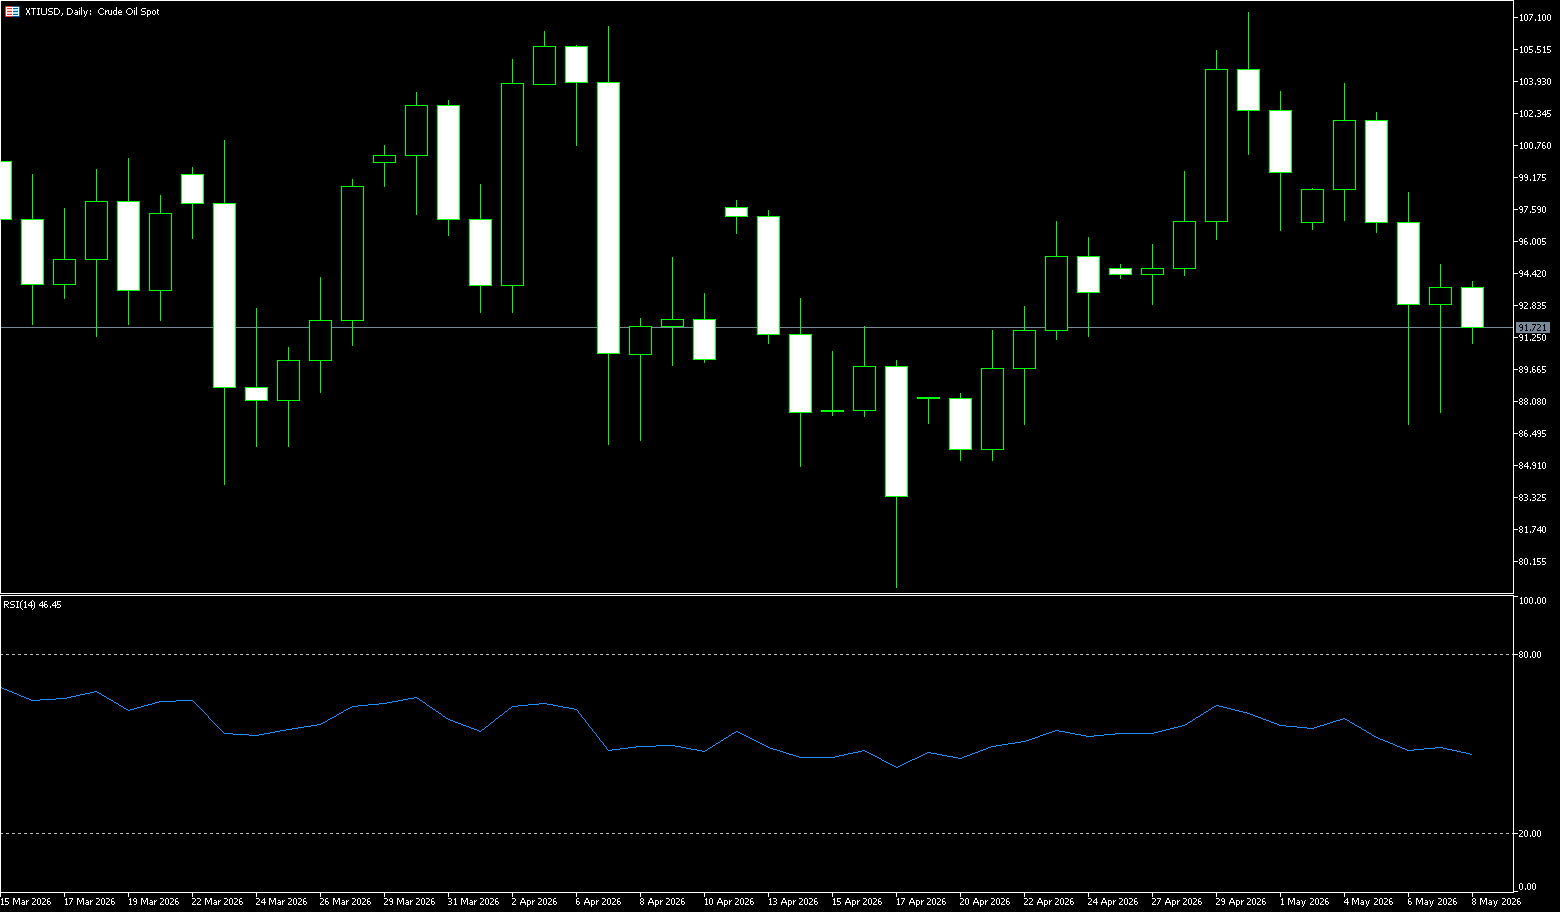
WTI crude oil fell below $97 a barrel on Wednesday, ending a three-day rally, despite ongoing Middle East conflict and the near closure of the Strait of Hormuz exacerbating global energy supply tensions. Efforts to mediate the US-Iran war have made no substantial progress, and the fragile ceasefire remains at risk after Washington rejected Tehran's latest response to a proposed peace framework. The Strait of Hormuz continues to be restricted by US and Iranian forces, serving as a major obstacle in negotiations and disrupting the flow of significant amounts of crude oil, natural gas, and fuel. Meanwhile, President Trump is expected to meet with Chinese President Xi Jinping this week, although Trump has stated that trade negotiations will take priority over developments related to the Iran conflict. On the other hand, US inflation accelerated more than expected in April, as soaring energy prices linked to the Middle East crisis added to price pressures.
From a technical perspective, the daily chart for WTI crude oil maintains a clear bullish trend. Currently, the price is trading above $96 and has not broken below the medium-term moving average support, indicating that the medium-to-long-term upward structure remains intact. Although oil prices previously experienced a slight pullback from the $107.36 area, the overall trend remains strong. However, the Stochastic Relative Strength Index (SRSI) has fallen back to around 40, indicating that the short-term upward momentum is beginning to slow. This means that although oil prices are still in a strong range, they may face periodic fluctuations and profit-taking pressure during further upward movement. WTI crude oil continues to maintain a high-level consolidation structure in the short term, with the short-term market more inclined towards consolidation than a trend reversal. The first short-term support level is at $95; a break below this level could lead to a further test of the $90.00 psychological level. On the upside, given the lack of significant technical resistance, the $100 psychological level will become the most important battleground between bulls and bears in the next phase. A successful break above this level could open up new upside potential to $107.36.
Today, consider going long on crude oil at 96.80, with a stop loss at 96.60 and targets at 98.00 and 99.00.
Spot Gold
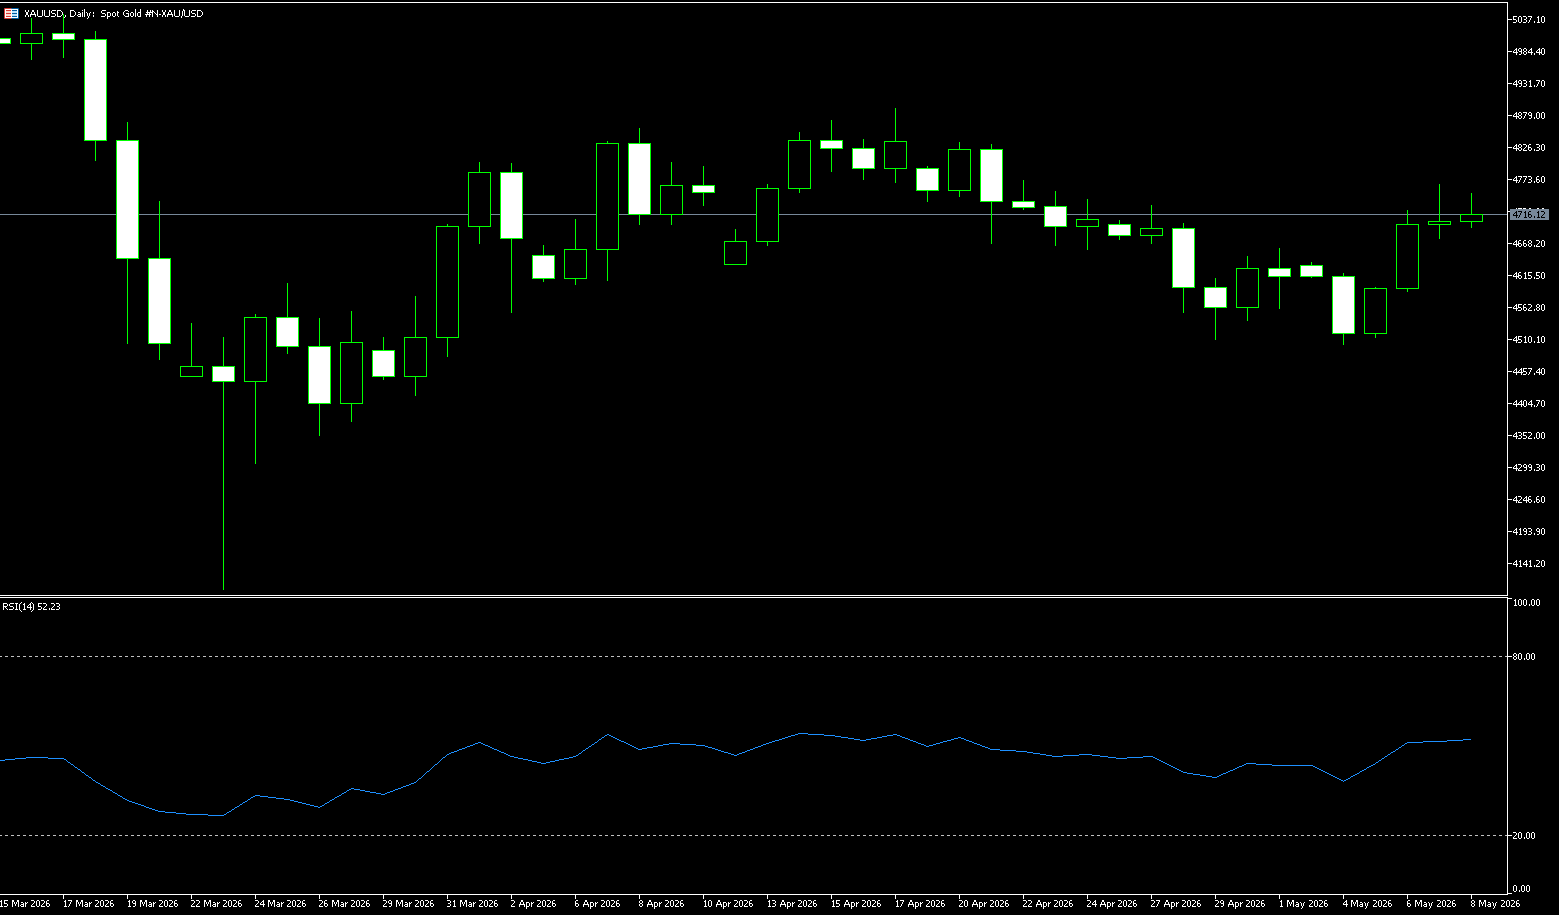
Spot gold briefly surged to a high of $4727 before rapidly retreating to around $4687, before recovering to close at $4690. Gold briefly fell below $4700 per ounce on Wednesday, pressured by stronger-than-expected US inflation data that reduced market expectations for a Federal Reserve rate cut. US consumer inflation accelerated to 3.8% in April, higher than the market forecast of 3.7% and the highest level since May 2023, driven by rising energy costs related to the Middle East conflict. In other news, India raised import tariffs on gold and silver to curb gold bar purchases and support its currency. Meanwhile, oil prices rose over the past three trading days as continued stalled diplomatic efforts to resolve the Iran war kept concerns about inflation and the energy market in focus. In other news, India raised import tariffs on gold and silver to curb gold bar purchases and support its currency.
On the daily chart, gold is trading below $4,700, maintaining a slightly bearish short-term tone as it hovers above the 20-day simple moving average around $4,684 while being capped below the 50-day simple moving average around $4,749. This position traps spot gold below a layer of medium-term resistance, with the longer-term 100-day moving average around $4,788 reinforcing the supply zone above, while the 14-day Relative Strength Index (RSI) is near neutral 50, indicating only mild directional confidence at present. Near-term resistance lies at the 50-day moving average around $4,749, followed by the 100-day moving average around $4,788, and the broader downtrend line that continues to suppress rallies. Initial support is provided by the 20-day moving average around $4,684, while more substantial support lies around the psychological level of $4,600. A downward break below the current consolidation level could allow long-term buyers to regain control.
Consider going long on gold today at $4,683, with a stop-loss at $4,677 and targets at $4,730 and $4,740.
AUD/USD
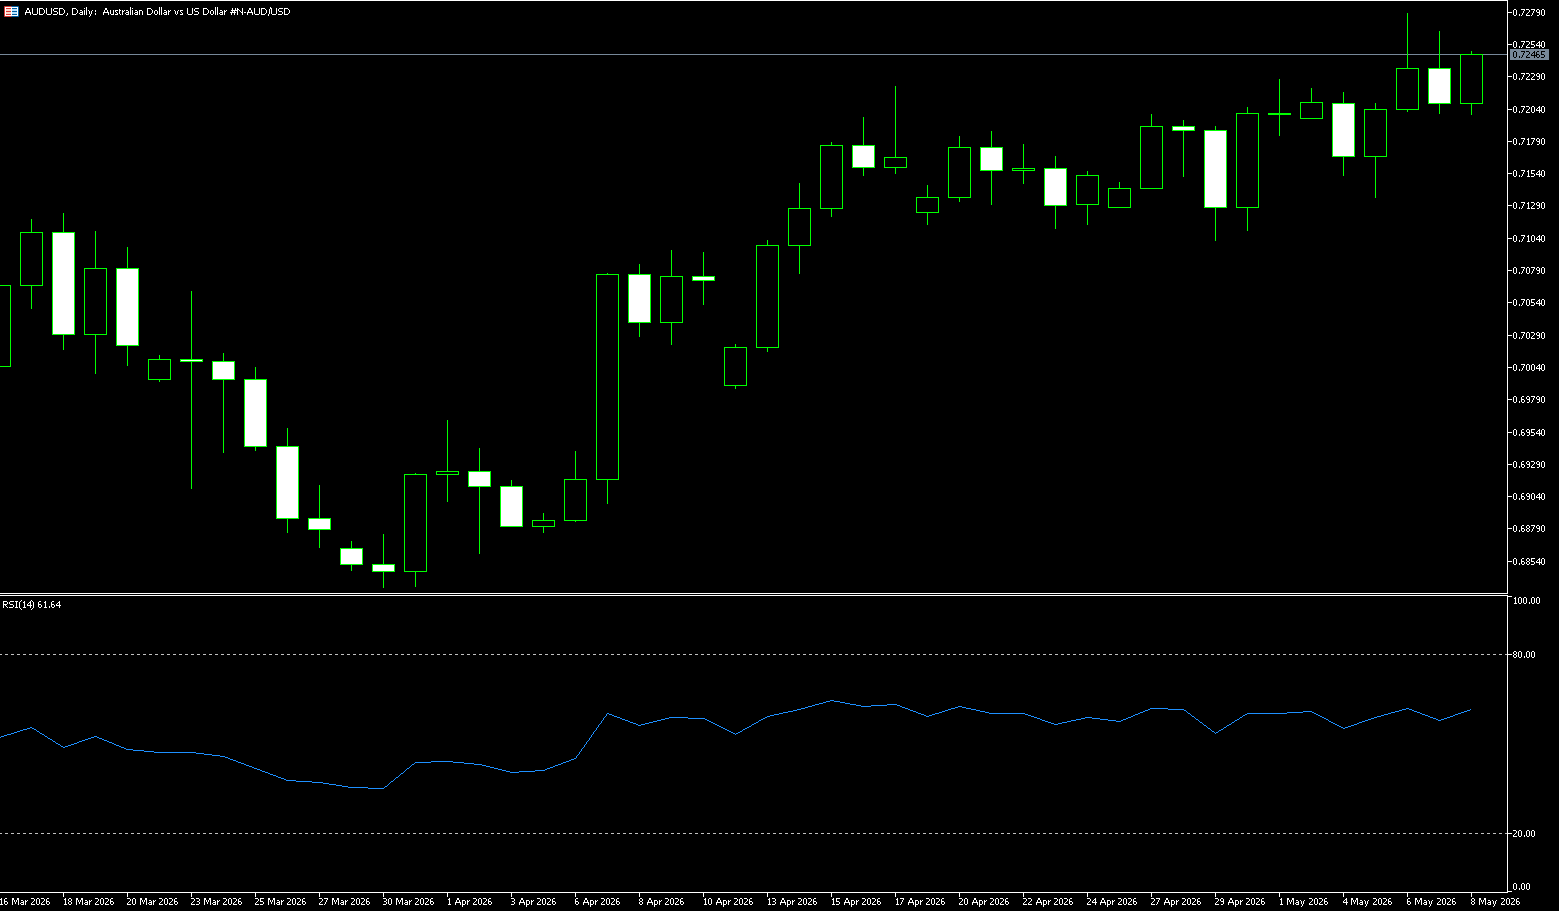
The Australian dollar traded around US$0.7260, but remained near its highest level since April 2022, as escalating geopolitical tensions kept market expectations for a hawkish policy outlook high. The US and Iran continue to face difficulties in finding a diplomatic solution, while the Strait of Hormuz remains effectively closed, leading to high energy prices and exacerbating inflation concerns. This has strengthened market expectations that the central bank may maintain higher interest rates for longer or raise rates further to curb price pressures. Last week, the Reserve Bank of Australia significantly raised its inflation forecast, expecting inflation to peak near 5%, while lowering its economic outlook. The updated forecast was released against the backdrop of policymakers raising interest rates to 4.35%, the third consecutive rate hike this year. The market now implies about a 20% chance of another rate hike in June, but fully priced in a 4.6% rate in September.
Spot prices remained stable above the 0.7187 simple moving average, maintaining a slight bullish bias. Furthermore, the Relative Strength Index (RSI) is hovering above the neutral 60 line, suggesting moderate upward pressure. However, the Moving Average Convergence Divergence (MACD) indicator is flattening slightly below the zero line, indicating that momentum is only initial. As a precaution, it is recommended to wait for the price to stabilize above the mid-range of 0.7200 before establishing a new bullish position in AUD/USD. The target is 0.7277, the highest level since June 2022, reached on May 6th. A sustained break above this level would support the pair's target of 0.7300 (the psychological level). On the downside, initial support is at the 20-day simple moving average of 0.7187. A break below this level would expose a deeper corrective pullback to 0.7100.
Consider going long AUD at 0.7246 today, with a stop loss at 0.7234 and targets of 0.7285 and 0.7290.
GBP/USD
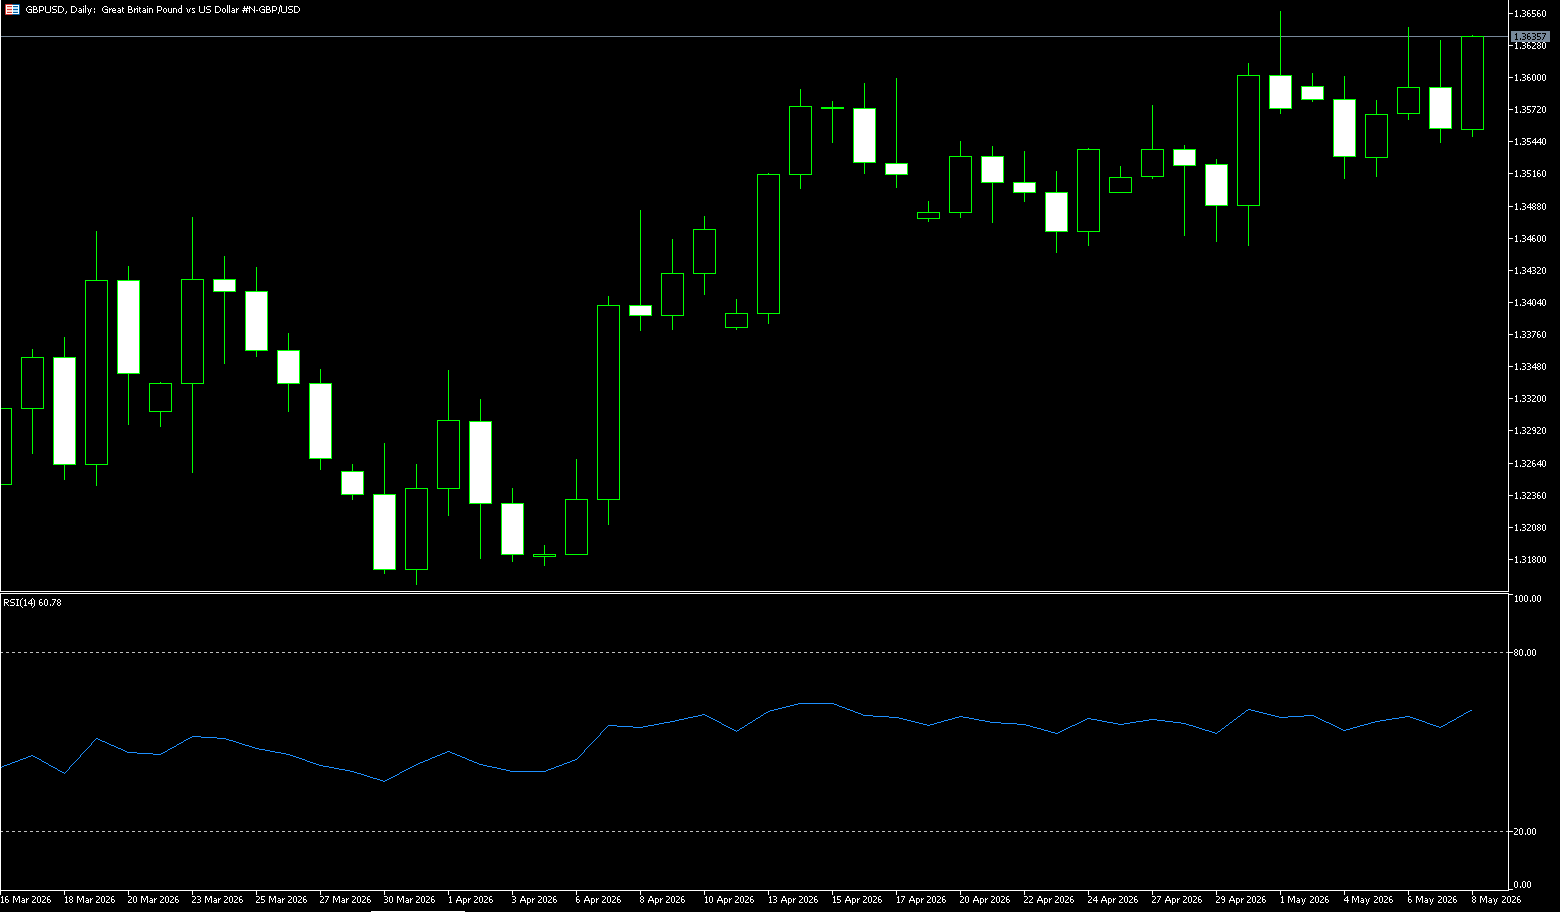
The pound pared some losses but remained below $1.3530, retreating to a near two-month high as political instability in the UK and stalled US-Iran negotiations weighed on market sentiment. Prime Minister Keir Starmer vowed not to resign during his term, despite pressure from over 70 Labour MPs demanding his resignation due to the party's poor performance in local elections. Investors worried that a leadership change could lead to higher fiscal spending to regain voter support, although Starmer stated that a leadership contest had not yet been triggered. Meanwhile, Brent crude prices rose after US President Trump announced a ceasefire agreement with Iran. Following its latest response and being placed in a state of "significant life support," the price climbed to over $105 per barrel. Traders are increasing their bets on further rate hikes from the Bank of England, with the market now anticipating nearly three additional rate increases by the end of the year.
On the daily chart, GBP/USD maintains a slightly bullish short-term bias as the spot price stabilizes above the 100-day simple moving average (1.3482). The pair is consolidating in the upper half of its recent trading range, with a Relative Strength Index (RSI) of 52.00, suggesting that the rally is solid but not overextended as the price approaches the upper boundary. Short-term resistance is near the 1.3600 level. The upper Bollinger Band at 1.3610, if clearly broken, would open up further upside potential to 1.3650. Initial support lies around the 100-day simple moving average at 1.3482, and near the lower Bollinger Band at 1.3418; these levels should limit pullbacks while maintaining the overall constructive pattern.
Consider going long on GBP at 1.3505 today, with a stop-loss at 1.3490 and a target of 1.3570. 1.3580
USD/JPY
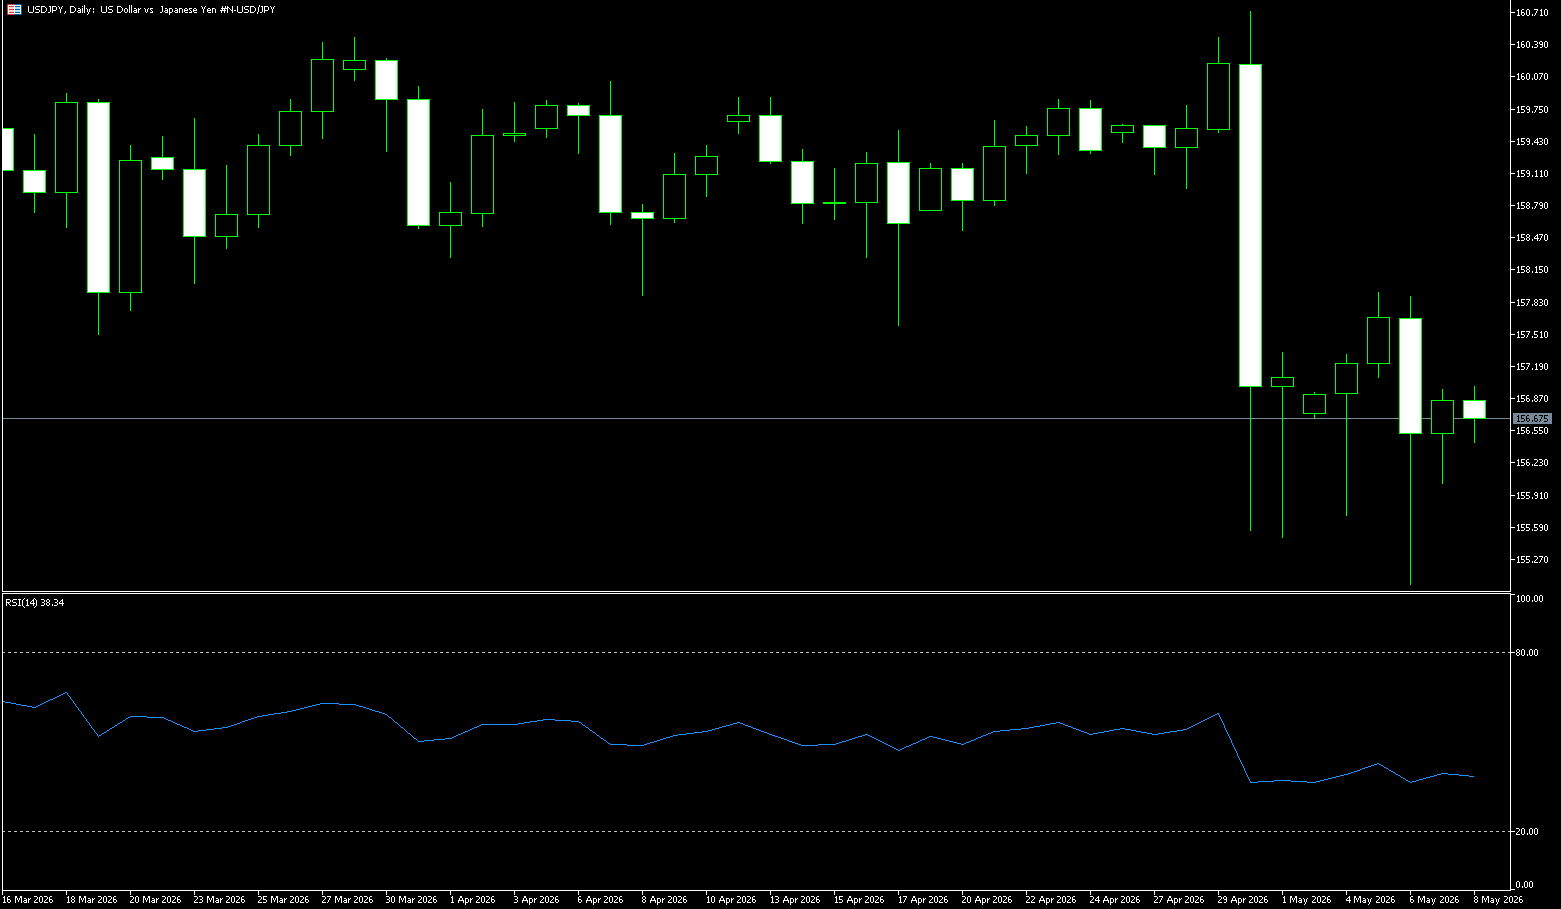
The dollar rose to 158 against the yen on Wednesday, marking its third consecutive day of gains, as the dollar strengthened on stronger-than-expected US inflation data, increasing expectations of a tightening Federal Reserve policy. In Japan, the Bank of Japan's April meeting summary showed policymakers discussed the possibility of raising interest rates as soon as possible at the next meeting, with rising oil prices exacerbating inflation concerns. The OECD also predicted that the Bank of Japan's policy rate could reach 2% by the end of 2027. Meanwhile, currency traders remained wary of potential intervention after US Treasury Secretary Scott Bessant stated that both the US and Japan consider excessive currency volatility undesirable, a statement interpreted as support for Tokyo's recent efforts to stabilize the yen.
From a daily chart perspective, the USD/JPY pair maintains a clear bullish structure overall. The pair is currently trading firmly above the 50-day and 200-day moving averages, indicating that the medium- to long-term upward trend remains intact. As the price approaches the 158.00 area again, the market is beginning to test resistance near previous highs. From a technical perspective, the daily MACD indicator continues to operate above the zero line, with the red histogram gradually expanding, indicating that the bullish trend still dominates. The Stochastic Relative Strength Index (SRSI) is approaching the overbought zone again, suggesting increased short-term buying sentiment but also hinting at increased risk of volatility at higher levels. The key resistance level on the daily chart is initially at the psychological level of 158.00. A successful break above this level could lead to further testing of the 159.50 area, or even a retest of the important psychological level of 160.00. On the downside, the 156.80 area provides initial support, followed by the 50-day moving average support area around 155.50. If the US dollar experiences a short-term pullback, these areas may attract some buying interest.
Today, consider shorting the US dollar at 157.99, with a stop-loss at 158.15 and a target of 157.10. 157.00
EUR/USD
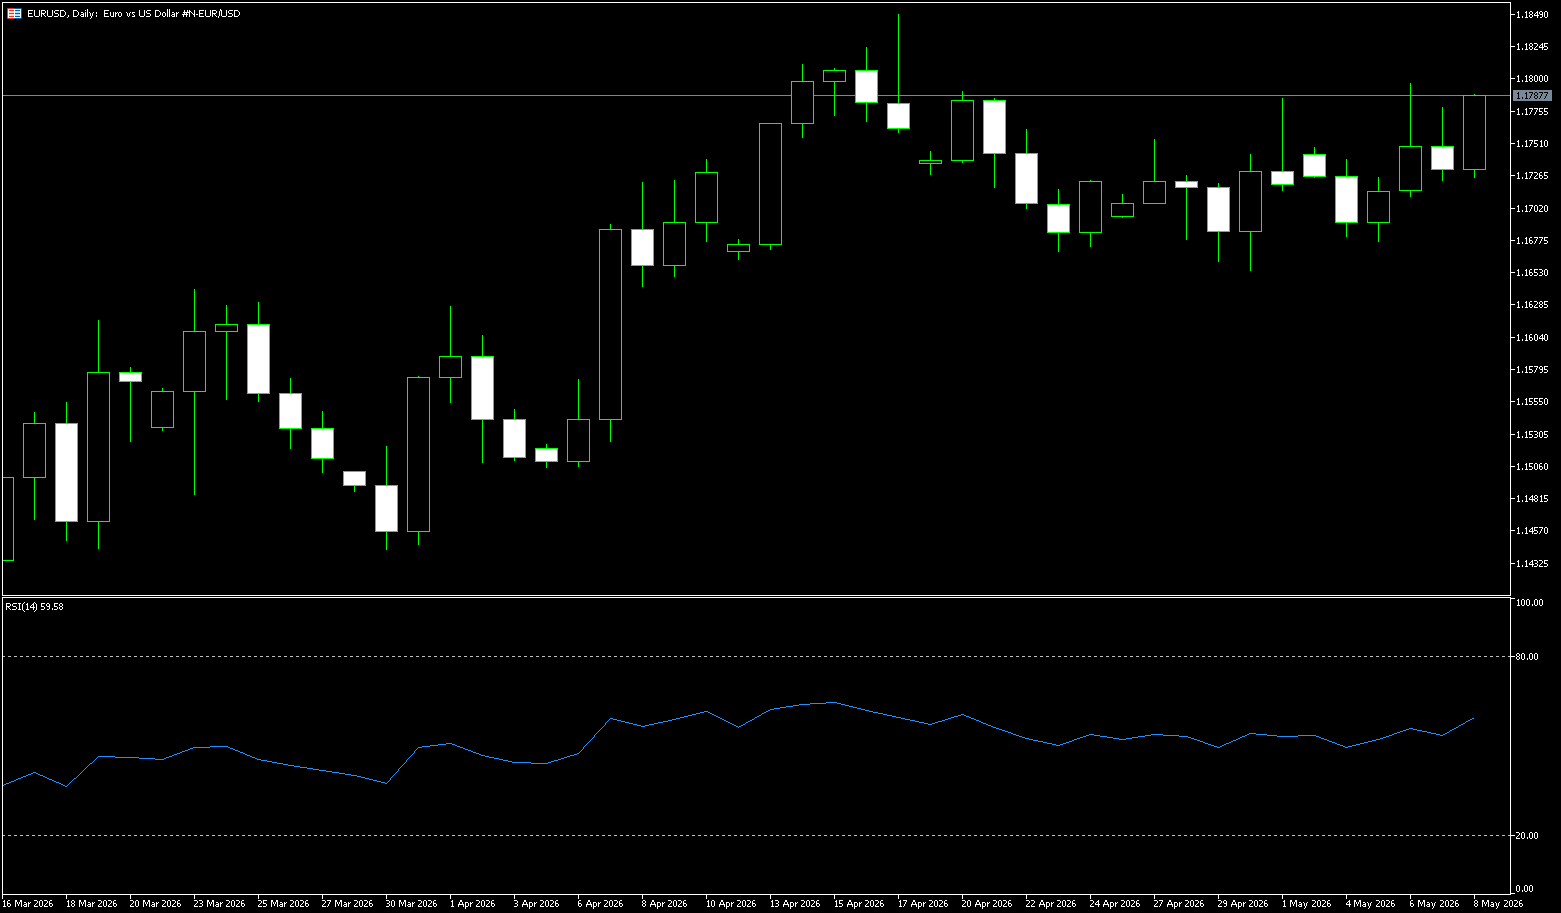
The euro fell to 1.17 against the dollar as investors assessed the impact of escalating tensions between the US and Iran and growing expectations for further interest rate hikes by the European Central Bank (ECB). Brent crude climbed above $105 a barrel after US President Trump rejected Iran's latest peace proposal, calling it unacceptable. The currency market now expects three ECB rate hikes this year, with a greater than 86% probability of the first hike in June. ECB President Christine Lagarde reiterated on Friday that the central bank is prepared to act swiftly if necessary, noting that the eurozone economy is now stronger than before Russia's invasion of Ukraine. On the economic data front, Germany's zew economic sentiment index rose seven points in May to -10.2, rebounding from a more than three-year low and exceeding market expectations. While this increase suggests a more optimistic outlook, the indicator remains negative, as investors await a swift resolution to the Iranian conflict.
The recent rally over the past two weeks or so has been confined within an upward channel. Furthermore, the EUR/USD exchange rate has held steady above the 200-period simple moving average on the 4-hour chart, reaffirming a constructive bias in the short term while the bullish structure remains intact. However, the Relative Strength Index (RSI) is hovering below 50, suggesting the market is consolidating rather than overextended.
Additionally, the latest MACD reading has turned slightly negative, indicating weakening upward momentum, even though price action remains trend-supported. Therefore, any further gains are likely to face initial resistance near the 1.1800 level, near the upper boundary of the trend channel. A clear break above this level would pave the way for a stronger bullish extension, potentially testing 1.1850 or even the year's high. Conversely, the EUR/USD could weaken again to the 1.1700 level, pushing the pair back down to between the 1.1681 (200-day moving average) and 1.1666 (38.2% Fibonacci retracement level).
Consider going long on the Euro today at 1.1705, with a stop-loss at 1.1695 and targets at 1.1750 and 1.1760.
Disclaimer: The information contained herein (1) is proprietary to BCR and/or its content providers; (2) may not be copied or distributed; (3) is not warranted to be accurate, complete or timely; and, (4) does not constitute advice or a recommendation by BCR or its content providers in respect of the investment in financial instruments. Neither BCR or its content providers are responsible for any damages or losses arising from any use of this information. Past performance is no guarantee of future results.
Lebih Liputan


Pendedahan Risiko:Instrumen derivatif diniagakan di luar bursa dengan margin, yang bermakna ia membawa tahap risiko yang tinggi dan terdapat kemungkinan anda boleh kehilangan seluruh pelaburan anda. Produk-produk ini tidak sesuai untuk semua pelabur. Pastikan anda memahami sepenuhnya risiko dan pertimbangkan dengan teliti keadaan kewangan dan pengalaman dagangan anda sebelum berdagang. Cari nasihat kewangan bebas jika perlu sebelum membuka akaun dengan BCR.
BCR Co Pty Ltd (No. Syarikat 1975046) ialah syarikat yang diperbadankan di bawah undang-undang British Virgin Islands, dengan pejabat berdaftar di Trident Chambers, Wickham’s Cay 1, Road Town, Tortola, British Virgin Islands, dan dilesenkan serta dikawal selia oleh Suruhanjaya Perkhidmatan Kewangan British Virgin Islands di bawah Lesen No. SIBA/L/19/1122.
Open Bridge Limited (No. Syarikat 16701394) ialah syarikat yang diperbadankan di bawah Akta Syarikat 2006 dan berdaftar di England dan Wales, dengan alamat berdaftar di Kemp House, 160 City Road, London, City Road, London, England, EC1V 2NX. Entiti ini bertindak semata-mata sebagai pemproses pembayaran dan tidak menyediakan sebarang perkhidmatan perdagangan atau pelaburan.

 English
 简体中文
简体中文
 繁體中文
繁體中文
 Bahasa
Melayu
Bahasa
Melayu
 Tiếng
Việt
Tiếng
Việt
 ไทย
ไทย
 日本語
日本語
 한국어
한국어
 ភាសាខ្មែរ
 español
