


0
US Dollar Index
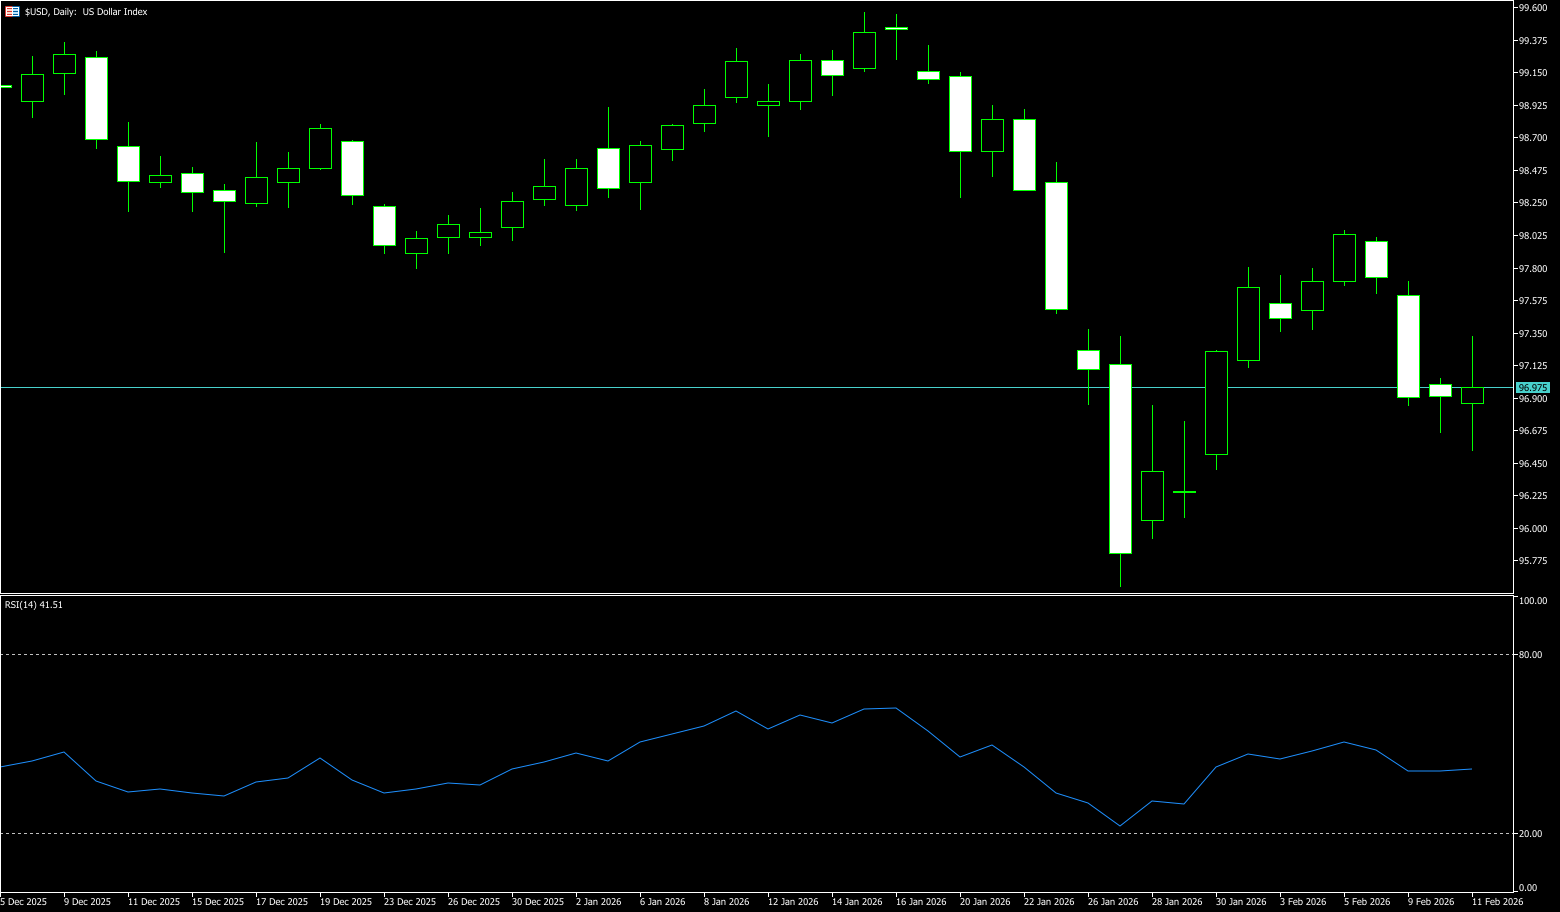
The US dollar index rebounded to near 97 after three days of decline, supported by stronger-than-expected US jobs data, which reduced market expectations for a Federal Reserve rate cut. US nonfarm payrolls increased by 130,000 in January, the largest increase in over a year, while the unemployment rate unexpectedly fell to 4.3%, indicating that the labor market is stabilizing in early 2026. This data prompted traders to reduce their easing bets, with the market now expecting the next Fed rate cut in July rather than June, and assessing the probability of a March rate cut as less than 5%. Interest rate swaps indicate about 49 basis points of easing by December, down from the previous 59 basis points. The Fed kept rates unchanged in January due to persistently high inflation and a resilient labor market, despite dissenting opinions from two policymakers regarding another rate cut.
Regarding the US Dollar Index, its 4-hour chart shows the price hovering closely around the Bollinger Band middle line (97.26), with the upper and lower bands (98.12 - 96.39) unusually narrowing, indicating that volatility compression is about to end. The MACD indicator shows weak short-term momentum, and the market is in a critical state of equilibrium between bulls and bears. Intraday, close attention should be paid to the price's testing of the Bollinger Band edges and whether the MACD can form a golden cross near the zero line, which would be a signal of short-term momentum shift. Key support and resistance zones can be defined as follows: the first support is at 96.39 (lower Bollinger Band line); a break below this level could open up room for a correction towards 96.00 (psychological level); the first resistance is at 97.00 (psychological level) and the 97.03 (14-period moving average) area; a valid break above this level would confirm the end of the short-term pullback and could potentially test the 97.47 (100-period moving average) level.
Today, consider shorting the US Dollar Index around 97.05; Stop loss: 97.15; Target: 96.65; 96.55
WTI Crude Oil
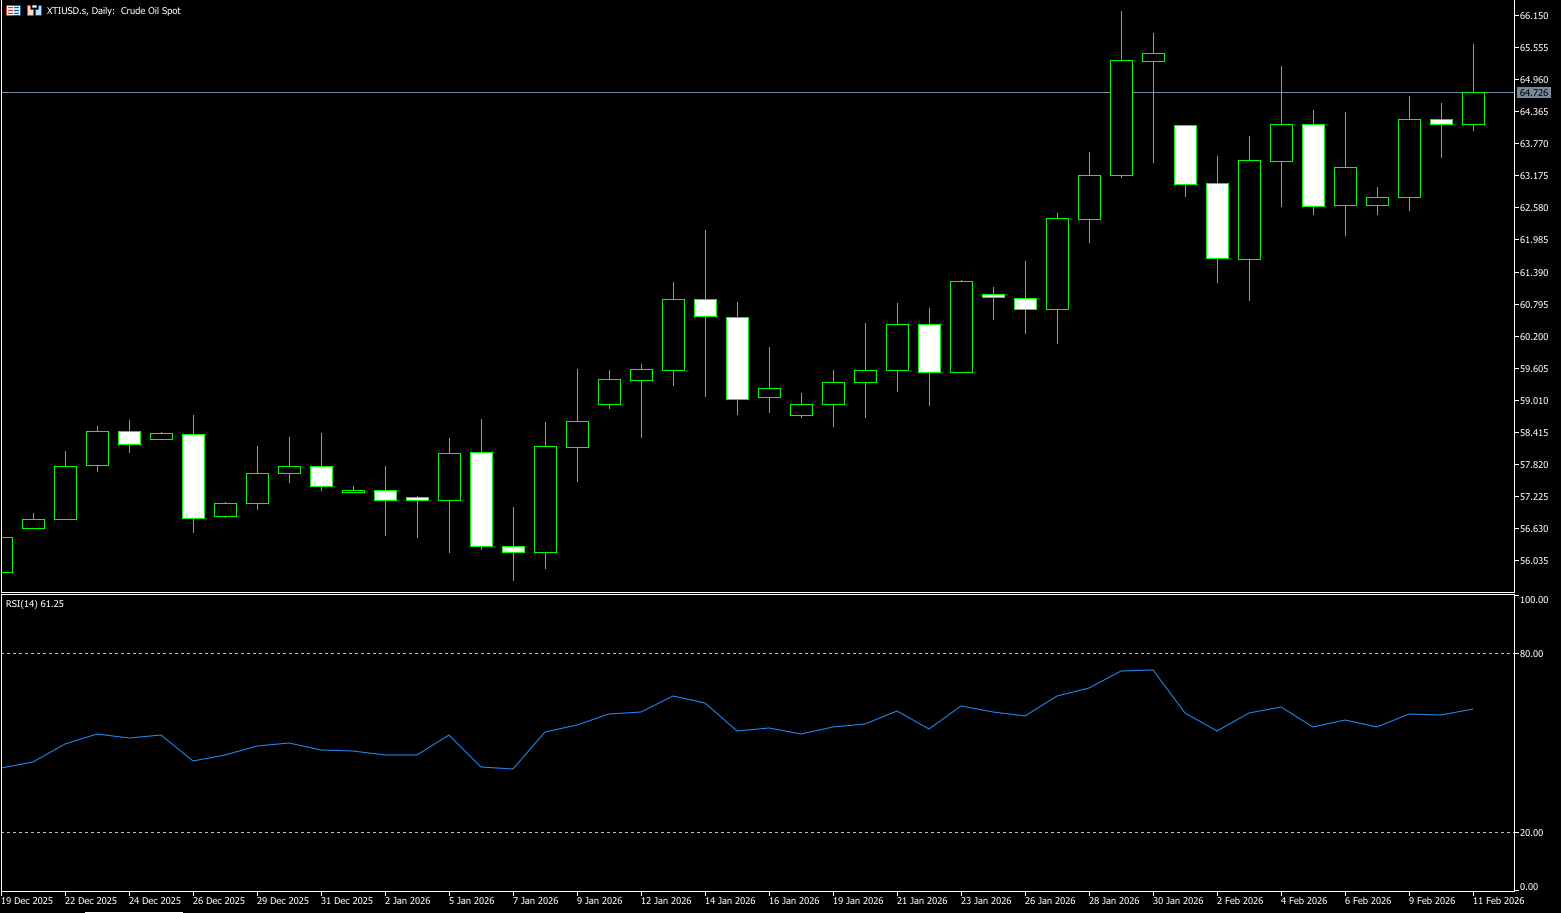
WTI crude oil rose to around $64.80 per barrel on Wednesday, reversing losses from the previous session, as ongoing tensions between the US and Iran supported prices. Reports indicated that Washington might consider intercepting tankers carrying Iranian crude oil and could deploy additional carrier strike groups should Iranian nuclear negotiations break down. Despite positive initial talks last week, traders worried that a failure to reach an agreement could trigger a US strike on Tehran, jeopardizing Iranian oil supplies or provoking retaliation. However, limiting further gains was a US industry report showing a significant increase in inventories, rising by 13.4 million barrels last week, which, if officially confirmed, would be the largest increase since November 2023. Investors will also be watching the OPEC monthly market outlook later today, and the International Energy Agency's (IEA) assessment, released on Thursday, warns that supply will exceed demand, leading to a large surplus this year.
Midweek, oil prices consolidated around the $64 mark, holding above the key pivot level of $63.36, the 14-day simple moving average. A break below this moving average would be the first signal of weakness in oil prices; a break below the lows of the $63.00 (psychological level) and $62.93 (16-day simple moving average) area would shift the momentum downwards. However, as long as the support in these areas holds, the long-term trend remains supported. Furthermore, the current 9-day moving average is gradually rising; if it crosses above $65.65 (this week's high), oil prices could potentially rise significantly to $66.24 (January 29th high). Momentum indicators show that the daily RSI has fallen from its high to neutral territory, meaning the current pullback is primarily a technical correction rather than a trend reversal.
Today, consider going long on crude oil around 64.60; stop loss: 64.35, target: 66.00; 66.50
Spot Gold
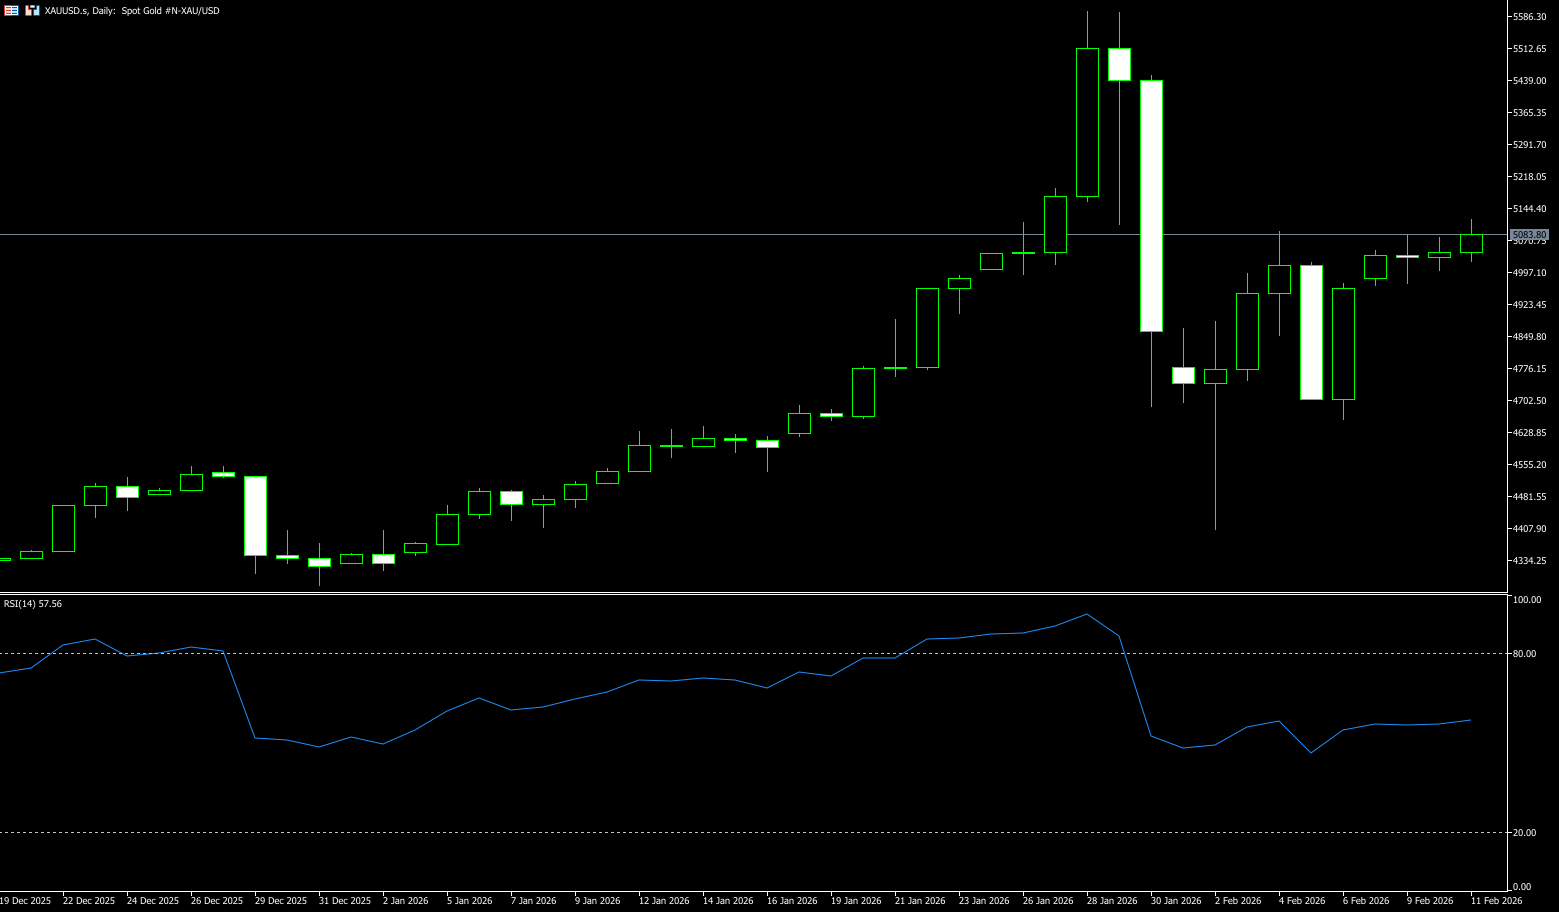
On Wednesday, spot gold traded around $5070 per ounce. Gold prices fell slightly on Tuesday, mainly as investors took profits and adjusted positions ahead of key US employment and inflation data releases. Slight pullbacks or consolidation in gold prices ahead of a large amount of key economic data releases are normal market behavior. He also pointed out that a weak dollar, geopolitical tensions, and market expectations of a Fed rate cut continue to support gold prices, with the psychological level of $5000 per ounce also providing some support. Market concerns about the economic outlook have strengthened expectations of rate cuts. Traders now widely expect the Fed to implement two 25-basis-point rate cuts this year. Since gold itself does not generate interest, lower interest rates will reduce the opportunity cost of holding gold, thus benefiting gold prices.
From a technical perspective, gold's medium-to-long-term uptrend remains intact. The daily chart shows an upward trend, with the 50-day moving average around $4,597 and trending upwards. Gold prices have consistently remained above this moving average, indicating a short-term bullish bias. Recently, gold prices have been consolidating within a wide range of $4,402.30 to $5,091.90, with a pivot point at $4,747.10. Currently, gold prices are in the upper part of this range, oscillating around the $5,000 level. This consolidation is conducive to building a solid bottom. The current consolidation is a process of bulls and bears battling and digesting selling pressure. Once gold prices break through the upper limit of the range at $5,091.90, the bottom will be established, potentially initiating a new medium-to-long-term uptrend to $5.182 (the high of January 27th). Conversely, if prices fall below the lower limit of $4,747.10, the medium-to-long-term trend may reverse, and gold prices may enter a correction phase towards $4,402.30.
Consider going long on gold around 5,070 today; Stop loss: 5,060; Target: 5,120; 5,130
AUD/USD
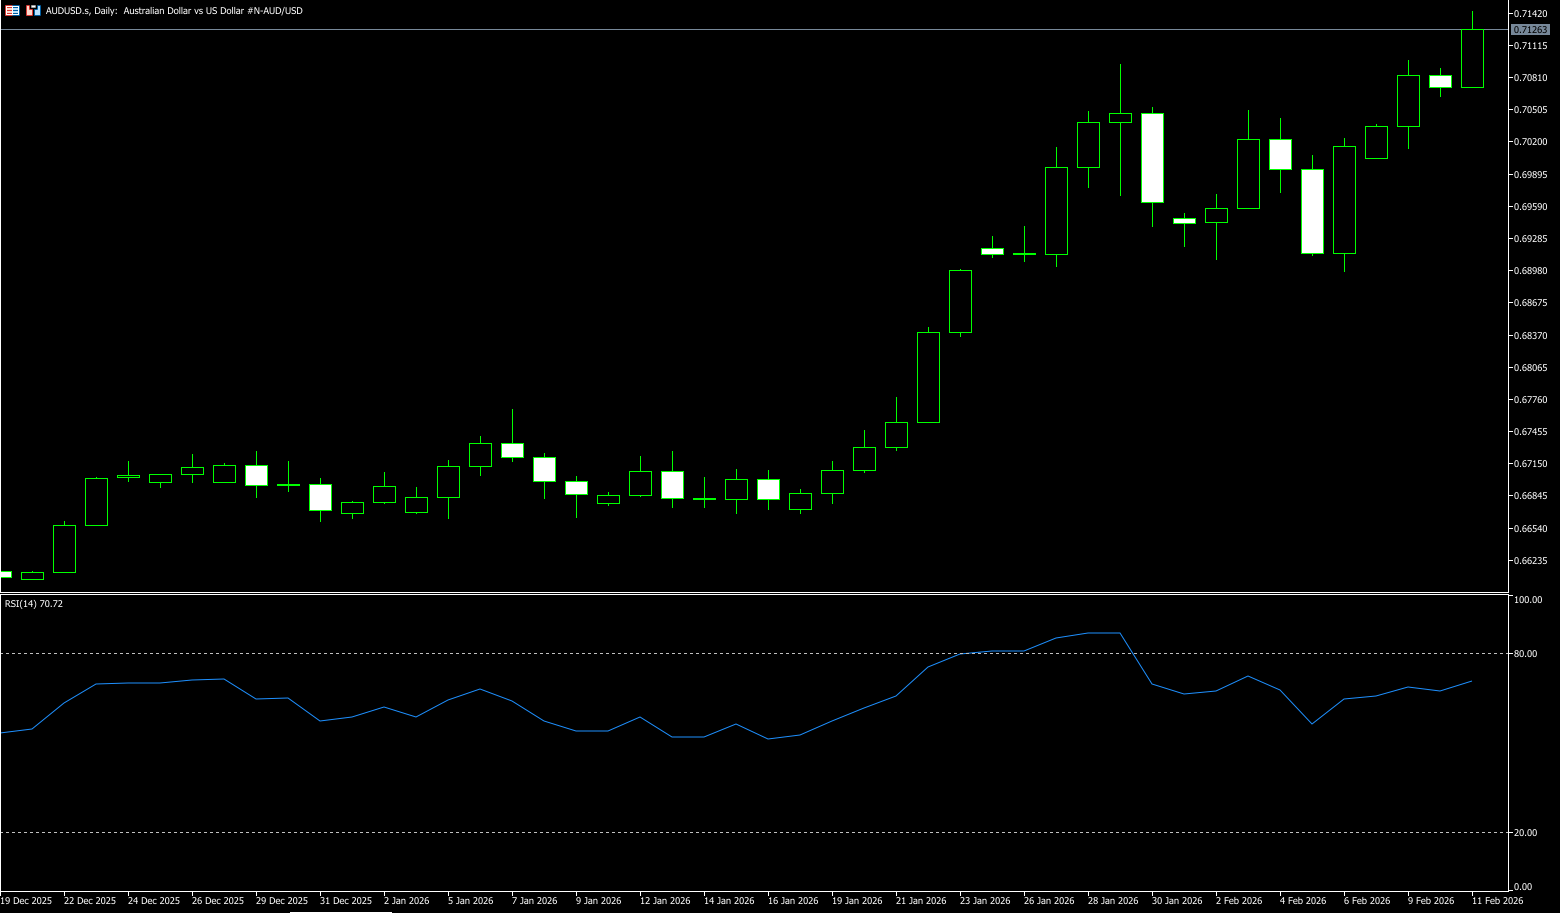
The AUD/USD pair recovered recent losses from the previous trading day on Wednesday, trading around 0.7100. The pair remained strong following the release of China's Consumer Price Index (CPI), which rose 0.2% year-on-year in January, compared to 0.8% in December. The market consensus was 0.4% for the reporting period. China's January CPI inflation was 0.2% month-on-month, unchanged from the previous month and below the expected 0.3%. Westpac's consumer confidence index fell 2.6% month-on-month in February to a 10-month low of 90.5, influenced by a 25 basis point rate hike, the first in over two years. Meanwhile, the National Australia Bank's business confidence index rose slightly to 3 in January, revised down from a previous reading of 2, reaching its highest level since October. The U.S. Census Bureau reported Tuesday that U.S. retail sales were flat at $735 billion in December, after rising 0.6% in November, missing expectations of a 0.4% increase.
The Australian dollar maintains a strong uptrend on the daily chart, with the price well above the 50-day and 100-day simple moving averages at 0.6773 and 0.6651, confirming a clear bullish high-low-low structure since the low near 0.6421 at the end of November. During the week, AUD/USD rose above the psychological level of 0.7100, reaching a three-year high. Immediate resistance is at the high of 0.7138 (October 2022 high). A strong break above 0.7100-0.7138 would target 0.7157 near the 2023 high and the 0.7200 psychological level. On the downside, support lies at 0.7022 (10-day simple moving average), followed by the psychological level of 0.7000, with a break below targeting the 16-day simple moving average at 0.6980.
Consider going long on the Australian dollar today around 0.7113; Stop loss: 0.7100; Target: 0.7160; 0.7170
GBP/USD
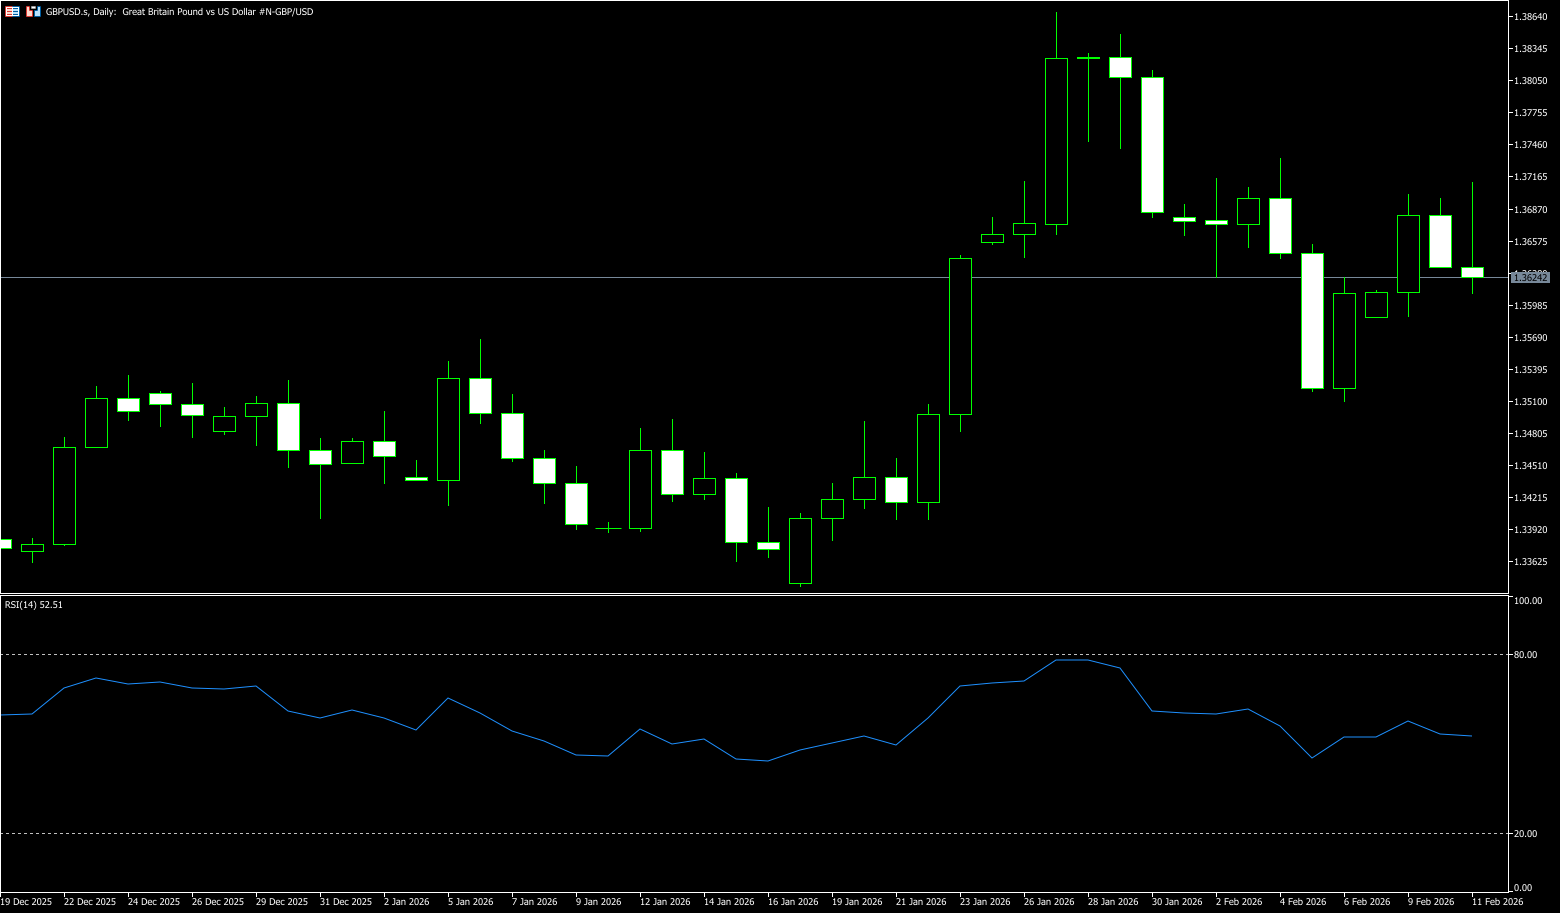
The pound rose against the dollar during Wednesday's North American session but retreated from its daily high of 1.3712 after a stronger-than-expected US jobs report. GBP/USD is trading around 1.3625. The pair may continue its decline as the pound faces pressure from rising UK political risk and expectations of a near-term Bank of England rate cut. Meanwhile, the Bank of England appears increasingly close to another rate cut, as the latest forecasts suggest inflation could fall below 2% in early April. Market bets on a Bank of England rate cut, potentially as early as March, have increased. Additionally, the dollar is hovering near a one-week low as markets bet on two more rate cuts by the Federal Reserve this year, putting dollar bulls on the defensive. Furthermore, the current risk-averse environment, supported by signs of easing tensions in the Middle East, has weakened the dollar's safe-haven status. This, in turn, may limit further losses in the GBP/USD pair and raise some concerns for bearish traders.
The GBP/USD pair showed resilience earlier this month below its 50-day simple moving average at 1.3501. Subsequent upward moves have benefited bullish traders. The MACD histogram remains positive, indicating the MACD line is above the signal line, while its recent contraction suggests weakening momentum near the zero level. The Relative Strength Index (RSI) at 55.35 reinforces the modest upward bias. Measuring from the high of 1.3862 to the low of 1.3510, the 50% Fibonacci retracement level at 1.3686 acts as resistance, while the 61.8% Fibonacci retracement level at 1.3727 limits the next hurdle. A break above 1.3727 would pave the way to 1.3800, while the first support zone is at 1.3607 (20-day simple moving average) and 1.3600 (psychological level). A break above this level targets 1.3550 (34-day simple moving average).
Consider going long on GBP/JPY today near 1.3610; Stop loss: 1.3600, Target: 1.3660; 1.3670
USD/JPY
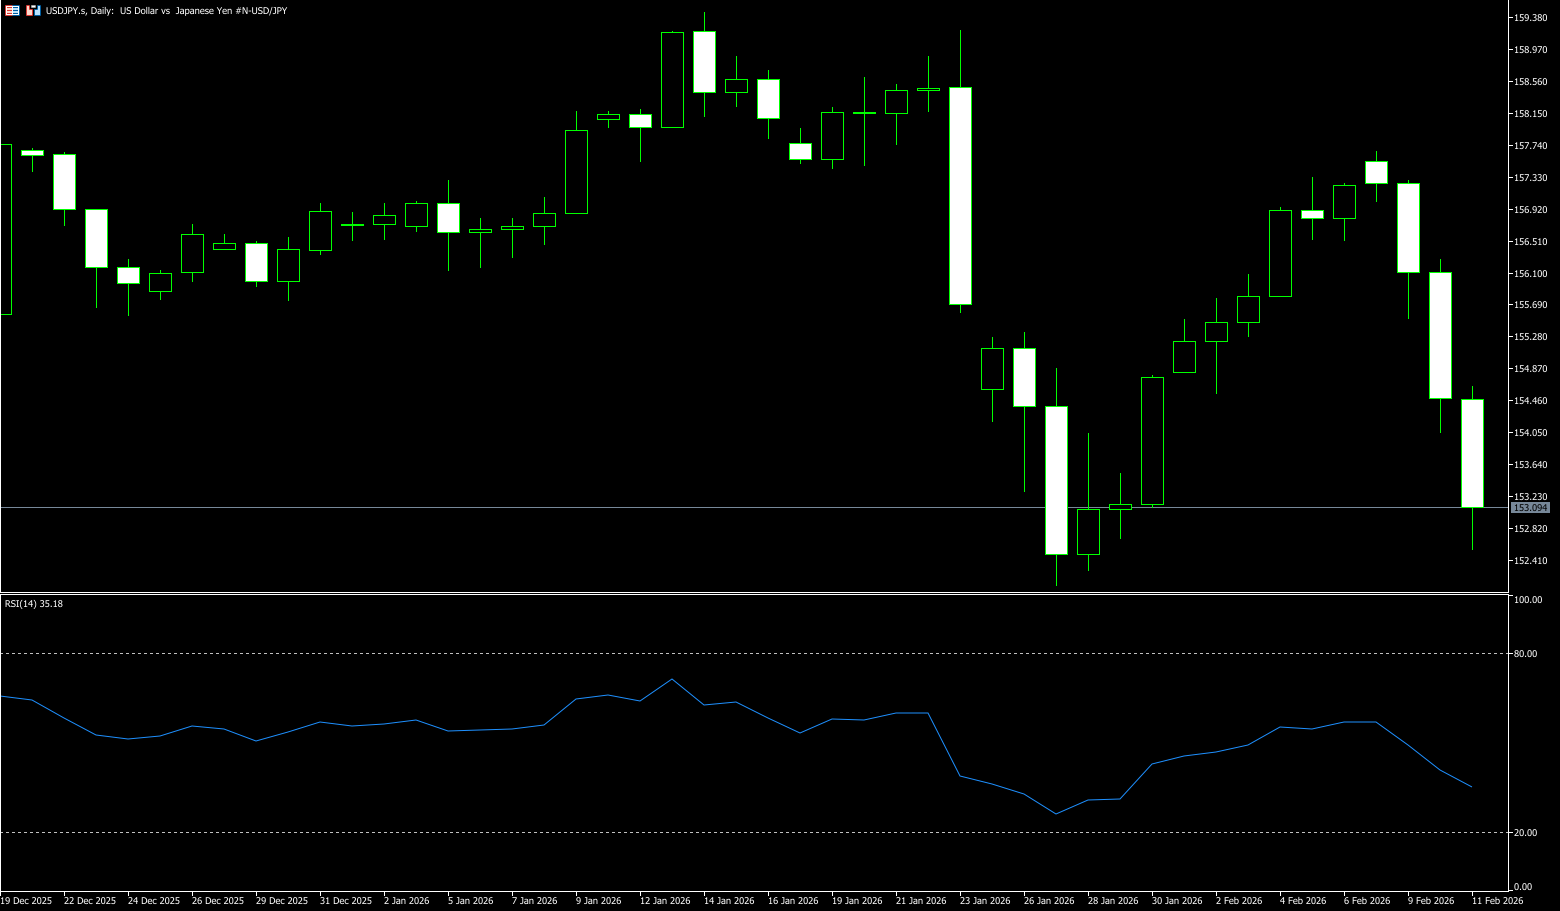
USD/JPY remained slightly above 153.00 during Wednesday's European session, facing significant losses from the past two days. Traders appear reluctant and may choose to wait for the delayed release of the US monthly jobs data. Sanae Takashi's victory did not accelerate the yen's depreciation; instead, the yen exhibited a "sell-the-news" pattern, with the USD/JPY pair falling instead of rising. Meanwhile, market bets on two more rate cuts by the US Federal Reserve this year, coupled with concerns about the Fed's independence, pushed the dollar near its more than one-week low reached on Tuesday. In contrast, Takashi's expansionary policies are expected to boost the economy and prompt the Bank of Japan to maintain a hawkish stance, continuing to support the yen. This, in turn, benefits USD/JPY bears and supports the possibility of further short-term depreciation. The release of Japan's fourth-quarter GDP report later this week adds another layer of event risk to the pair.
At the start of the week, a decisive close below the 50-day simple moving average at 156.29 on the daily chart would shift the short-term bias to the downside, with immediate support at 153.00 (psychological level) and 153.01 (130-day simple moving average). This is followed by the consolidation range around the January 28 low of 152.18 and the 152.00 level. Resistance lies at 155.26, near the broken 89-day simple moving average, followed by the 156.00 (psychological level) to 157.66 (this week's high) area. The MACD indicator shows a bearish crossover near the zero line, with momentum turning negative, suggesting increasing downward pressure. The Relative Strength Index (RSI) is at 39.40, below the 50 midline, reflecting weak momentum and opening room for a deeper pullback.
Consider shorting the US dollar today near 153.45; Stop loss: 153.60; Target: 152.60; 152.40
EUR/USD
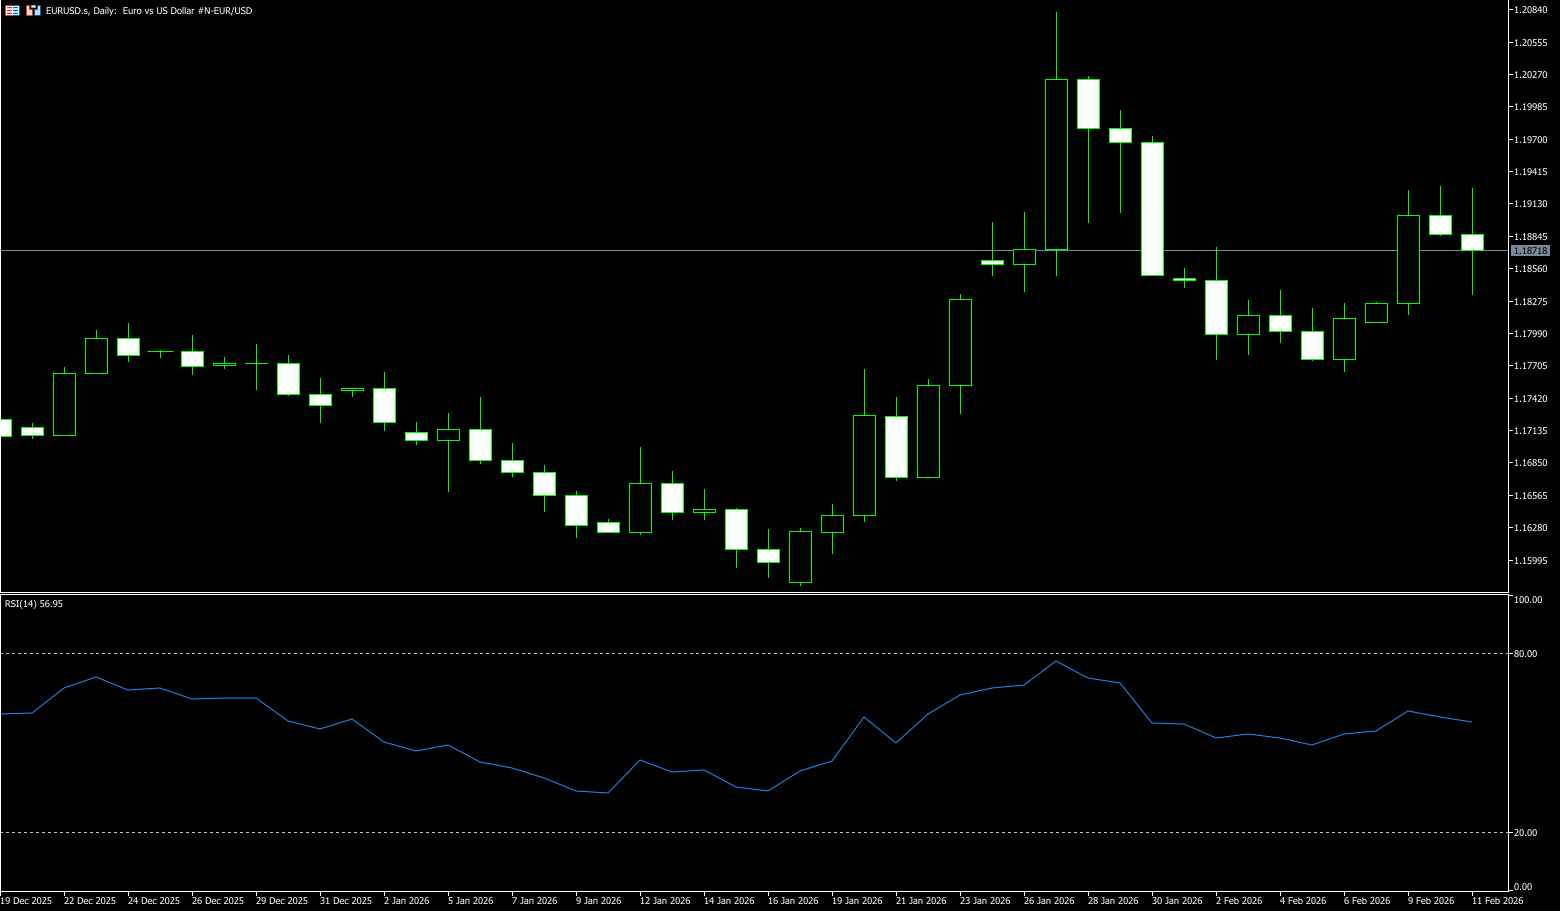
During Wednesday's European session, the EUR/USD pair fluctuated within a narrow trading range near 1.1900, awaiting new directional bets. The divergence in interest rate paths between the Federal Reserve and the European Central Bank continues to support the EUR/USD pair as key data risks approach. Disappointing U.S. retail sales data released Tuesday boosted investor expectations for multiple interest rate cuts by the U.S. central bank this year. In contrast, the European Central Bank has kept rates unchanged since ending a year-long rate-cutting period last June, with unexpectedly strong growth leaving policymakers without pressure to provide further support. Meanwhile, concerns about the Federal Reserve's independence resurfaced after U.S. President Trump said on Saturday he might sue if his newly appointed Fed chair nominee Kevin Warsh does not cut rates. Furthermore, despite hawkish comments from Fed officials indicating their desire to keep rates unchanged for the time being to address inflation concerns, the safe-haven dollar remained under pressure.
The euro/dollar pair is trending neutral, but after hitting a year-to-date high of 1.2082, it established a higher low around 1.1765. Since then, the pair has risen to 1.1900, although bullish momentum has weakened as indicated by the Relative Strength Index (RSI). For a bullish outcome, traders are watching for a decisive break above 1.1900. Once broken, the next target will be the January 30 high of 1.1974, followed by the January 29 peak of 1.1996, and then 1.2000. Conversely, if the bears push the price below the 1.1850 area, the 1.1800 level will be exposed, followed by the February 6 low of 1.1765. A break above the latter would open the possibility of testing the 100-day simple moving average at 1.1681.
Consider going long on the Euro today near 1.1860; Stop loss: 1.1850; Targets: 1.1920, 1.1940
Disclaimer: The information contained herein (1) is proprietary to BCR and/or its content providers; (2) may not be copied or distributed; (3) is not warranted to be accurate, complete or timely; and, (4) does not constitute advice or a recommendation by BCR or its content providers in respect of the investment in financial instruments. Neither BCR or its content providers are responsible for any damages or losses arising from any use of this information. Past performance is no guarantee of future results.
Lebih Liputan


Pendedahan Risiko:Instrumen derivatif diniagakan di luar bursa dengan margin, yang bermakna ia membawa tahap risiko yang tinggi dan terdapat kemungkinan anda boleh kehilangan seluruh pelaburan anda. Produk-produk ini tidak sesuai untuk semua pelabur. Pastikan anda memahami sepenuhnya risiko dan pertimbangkan dengan teliti keadaan kewangan dan pengalaman dagangan anda sebelum berdagang. Cari nasihat kewangan bebas jika perlu sebelum membuka akaun dengan BCR.
BCR Co Pty Ltd (No. Syarikat 1975046) ialah syarikat yang diperbadankan di bawah undang-undang British Virgin Islands, dengan pejabat berdaftar di Trident Chambers, Wickham’s Cay 1, Road Town, Tortola, British Virgin Islands, dan dilesenkan serta dikawal selia oleh Suruhanjaya Perkhidmatan Kewangan British Virgin Islands di bawah Lesen No. SIBA/L/19/1122.
Open Bridge Limited (No. Syarikat 16701394) ialah syarikat yang diperbadankan di bawah Akta Syarikat 2006 dan berdaftar di England dan Wales, dengan alamat berdaftar di Kemp House, 160 City Road, London, City Road, London, England, EC1V 2NX. Entiti ini bertindak semata-mata sebagai pemproses pembayaran dan tidak menyediakan sebarang perkhidmatan perdagangan atau pelaburan.

 English
 简体中文
简体中文
 繁體中文
繁體中文
 Bahasa
Melayu
Bahasa
Melayu
 Tiếng
Việt
Tiếng
Việt
 ไทย
ไทย
 日本語
日本語
 한국어
한국어
 ភាសាខ្មែរ
 español