


0
US Dollar Index
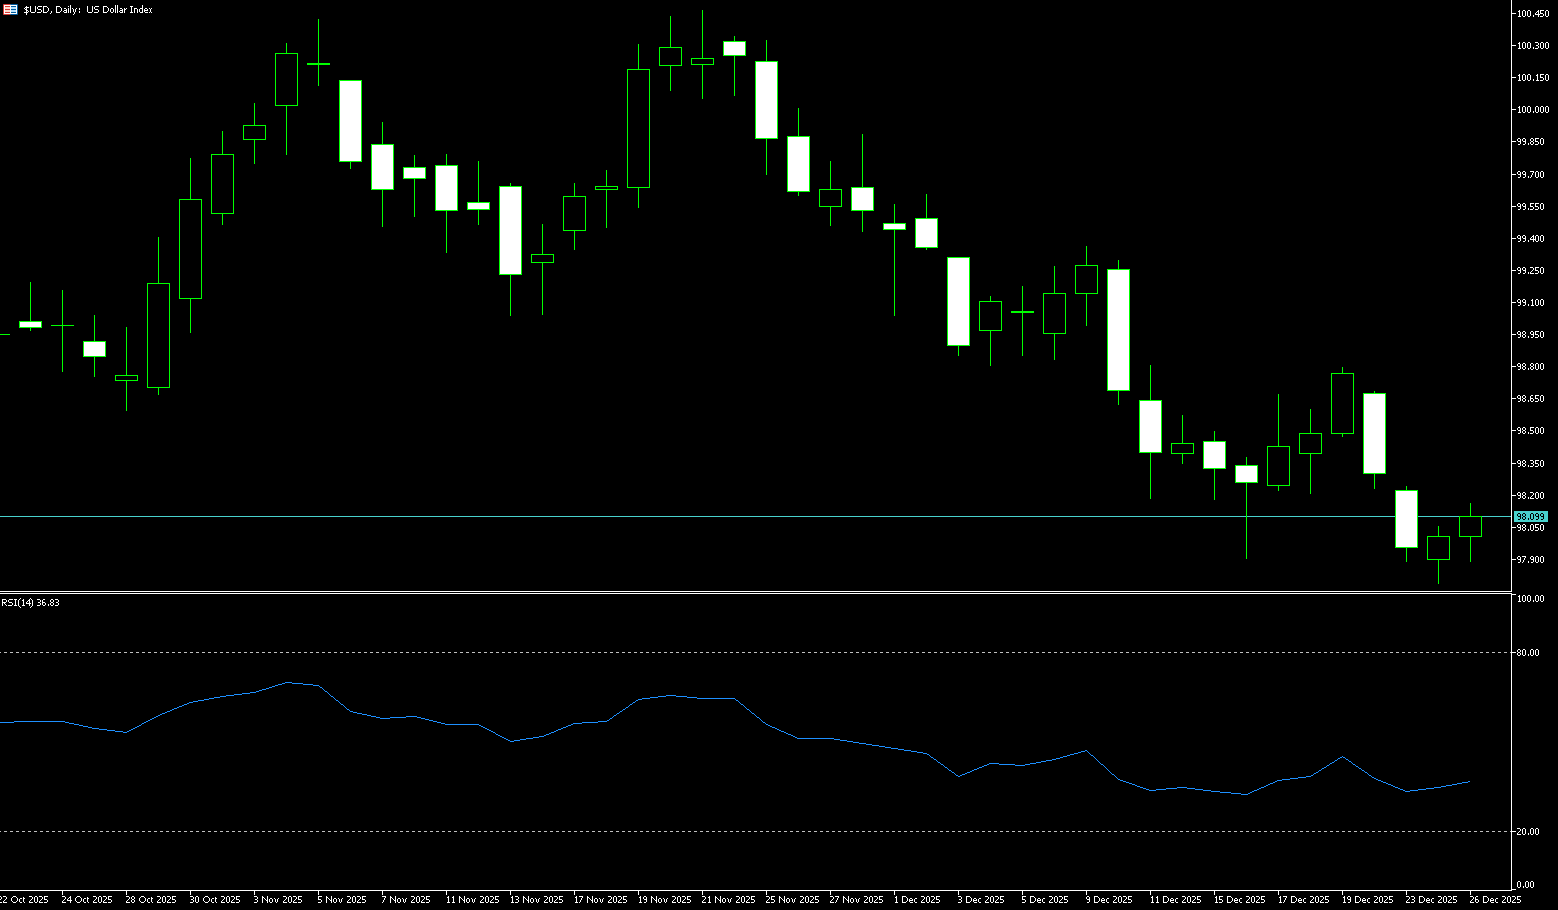
The US dollar remained around 98.00 until the end of last week, still at its lowest level since early October, as investors anticipated the Federal Reserve would lower borrowing costs again next year. Strong GDP data released on Tuesday had little impact on the interest rate outlook, with the market still expecting two more rate cuts in 2026. Amid escalating geopolitical tensions, precious metals rose due to increased safe-haven demand, putting pressure on the dollar. So far this year, the dollar has fallen 9.7%, on track for its weakest year since 2017. President Trump's aggressive tariff policies and threats to the Fed's independence exacerbated the pressure on the greenback earlier this year. Dovish sentiment in monetary policy has become a core variable dominating dollar index trading. In a recent blog post, Bessant mentioned his desire to abolish the dot plot and reduce the size and function of the Fed, meaning to no longer allow the central bank to be the absolute protagonist on the economic stage. On the other hand, the inherent weakness of the dollar index essentially stems from the significant divergence in the monetary policy paths of major global economies, which is a direct reflection of the interest rate differential logic in foreign exchange trading. The market anticipates a cumulative 50 basis point rate cut by the Federal Reserve in 2026, while the Bank of Japan is expected to raise rates by another 25 basis points, and the European Central Bank is likely to maintain its current interest rates. This reversal in interest rate expectations continues to suppress the attractiveness of the US dollar as a high-yield asset—even if other central banks simultaneously implement easing measures, the dollar's hegemonic position in the global financial system makes the US interest rate path the core anchor for market pricing, and the narrowing interest rate differential directly translates into downward pressure on the dollar index.
Last week, the dollar index exhibited a technical pattern of breaking down and then consolidating at low levels. The daily chart clearly shows a bearish structure, with limited short-term rebound potential. Low year-end liquidity may limit volatility. In the first ten days of last week, the dollar index rebounded to a high of 98.75, then fell continuously, breaking below 98.00 to a low of 97.75, confirming short-term weakness. With low liquidity expected from the end of the year to the New Year's holiday, the dollar index may maintain a range-bound movement between 97.00 (the psychological level) and 98.42 (the 14-day moving average). At present: The 5-day, 10-day, and 20-day short-term moving averages have all turned downwards, forming a standard bearish pattern. The index continues to be pressured below the moving averages, and the medium-term downward trend is clear. The RSI (14) has fallen to 36.84, but has not yet reached the oversold zone, indicating that the bears still have room to extend their influence and the rebound momentum is insufficient. In addition, the MACD is running below the zero axis, and the green bars continue to expand, indicating that the bearish momentum is strengthening and there is no bottom divergence signal yet. Gold prices are consolidating in a narrow range below the Bollinger Bands, with the bandwidth narrowing, and short-term range-bound fluctuations may continue. Currently, the US dollar index is in a downward channel with "highs moving lower and lows moving lower"; after the daily chart broke below 98.50, it formed a bearish rhythm of "breakdown - rebound - further decline"; the medium-to-long-term signal of a "golden cross" (19th) presented by the 50/200-day moving averages is temporarily suppressed by the short-term bears and needs to be verified by subsequent prices. If the index fails to recover the 98.00 (psychological level) - 98.25 (10-day moving average), the next targets are 97.75 (last week's low) and 97.46 (October 1st low), with an extreme scenario pointing to the 97.00 (psychological level). On the other hand, if the US dollar index stabilizes above 98.00 and breaks above 98.42 (14-day moving average), it may trigger a technical rebound to the 98.75 (last week's high) - 99.00 (psychological level) area.
Today, consider shorting the US dollar index near 98.12; stop loss: 98.25; target: 97.60; 97.70
WTI Crude Oil
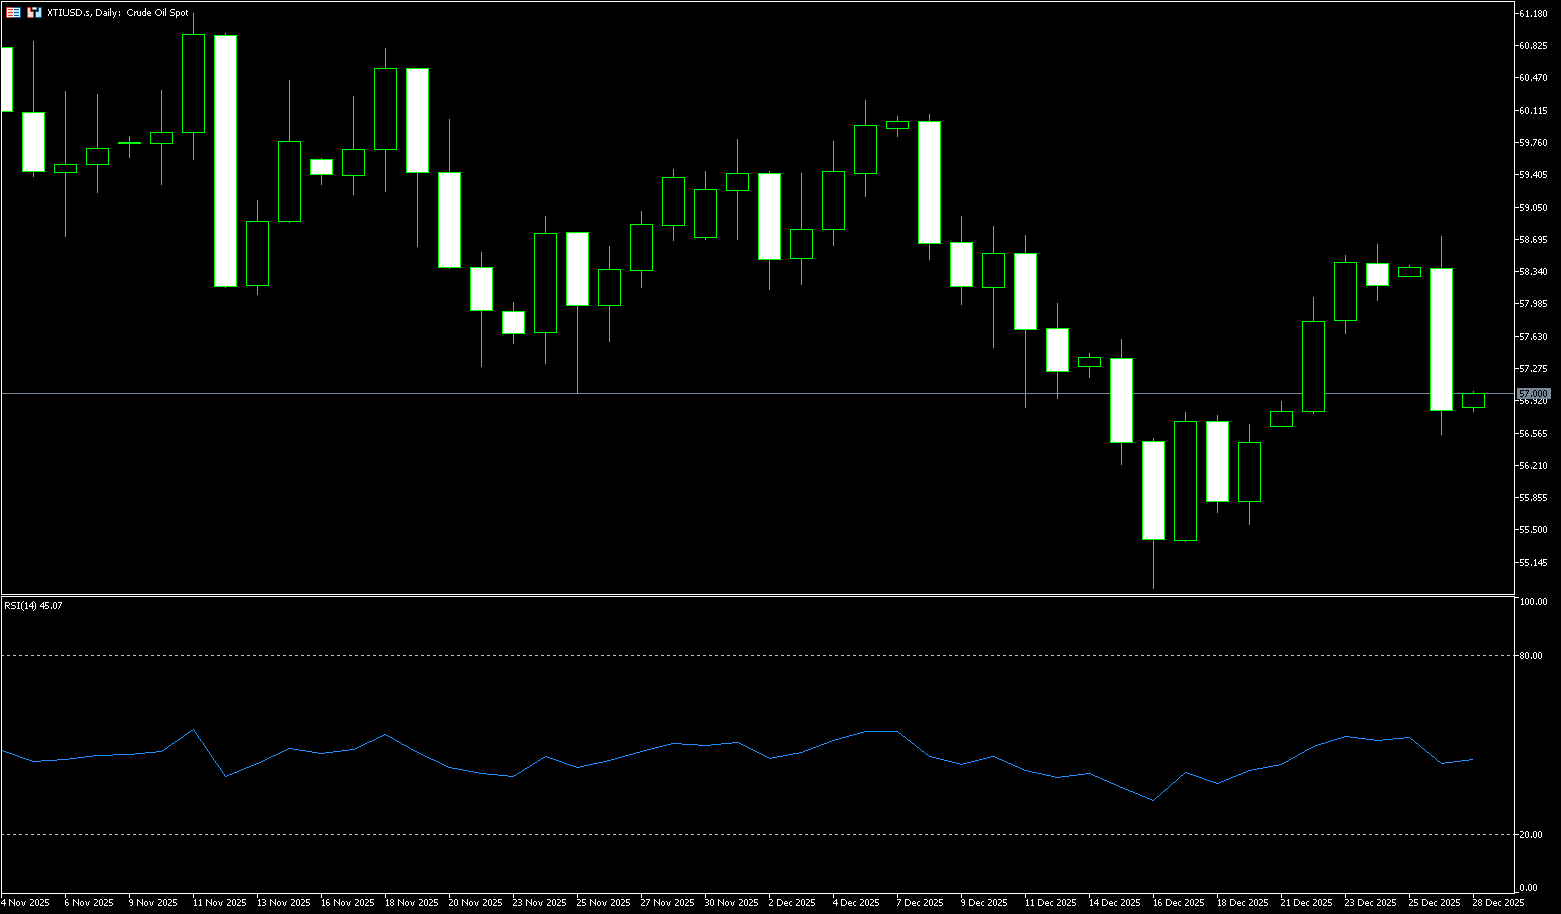
Last week, trading in the crude oil market was thin before and after the Christmas holidays. WTI crude oil prices closed slightly higher last week, at around $56.83 per barrel, a modest increase of 0.53% for the week. Market fundamentals remain dominated by oversupply. The International Energy Agency (IEA) reports that global oil supply will exceed demand by 3.84 million barrels per day in 2026. While geopolitical factors provide short-term support, they do not change the fundamental oversupply situation. Meanwhile, investors are closely watching the prospects for peace between Russia and Ukraine, which could potentially impact oil prices. A peace agreement and the lifting of sanctions on Russian oil could further increase global supply, injecting uncertainty into this apparent calm. Currently, the crude oil market is under the dual influence of a typical "holiday mode" and "year-end clearing." Shrinking trading volumes amplify the volatility of individual news events, but also mean that any price breakout requires further verification. On the surface, the US's "oil isolation" policy towards Venezuela and its coordinated military action with Nigeria provide immediate geopolitical support, preventing prices from falling after the holidays. However, these events have not ignited strong bullish sentiment, and the expectation of a significant year-end decline in oil prices remains a looming threat. For traders, understanding the current market contradictions is crucial: on the one hand, there are frequent risks of supply disruptions, and on the other hand, there is the reality of weak demand growth and high inventory levels at the macro level. This contradiction forms a clear battleground on the technical charts.
WTI crude oil exhibited a pattern of "rebounding from lows and then consolidating at highs" last week. The medium-term trend remains bearish, while short-term volatility was amplified by geopolitical factors and low liquidity, resulting in a rebound of approximately 6% for the week. The daily chart shows that WTI crude oil has been trending upwards since touching support at $54.88 on December 16th, with alternating bullish and bearish candlesticks indicating a stalemate between bulls and bears. After reaching $58.00 on December 22nd-23rd, it reached a near two-week high of $58.67, before falling back to consolidate before $58.00 due to thin trading during the holiday. Currently, all moving averages are in a standard bearish alignment (price continues to trade below the 20/50/100-week moving averages), and the medium-term downtrend remains unchanged. The weekly candlestick closed with upper and lower shadows, indicating a technical correction after an oversold condition rather than a reversal. The RSI (14) has rebounded to around 50, suggesting a marginal weakening of bearish momentum, but it hasn't turned bullish. The MACD histogram is narrowing, but there's no clear golden cross signal, indicating a continued bearish bias in the medium term. Currently, the expectation of oversupply remains unchanged, low liquidity during the holiday, higher-than-expected inventory data, and easing geopolitical tensions could all trigger a failed rebound and a return to the downtrend. The key levels to watch are $58.67 and $59.00. A sustained hold above these levels could extend the rebound to $60.00 (a psychological level) and even further towards the $60.71 (100-day moving average) resistance level. If the price breaks below $56.58 (last Friday's low), the next target is $55.60 (last week's low). A break below that level would lead to further targets at $55.14 (May 5th low) and $54.88 (December 2016 low).
Consider going long on crude oil today around $56.65; Stop loss: $56.50; Target: $58.00; $58.30
Spot Gold
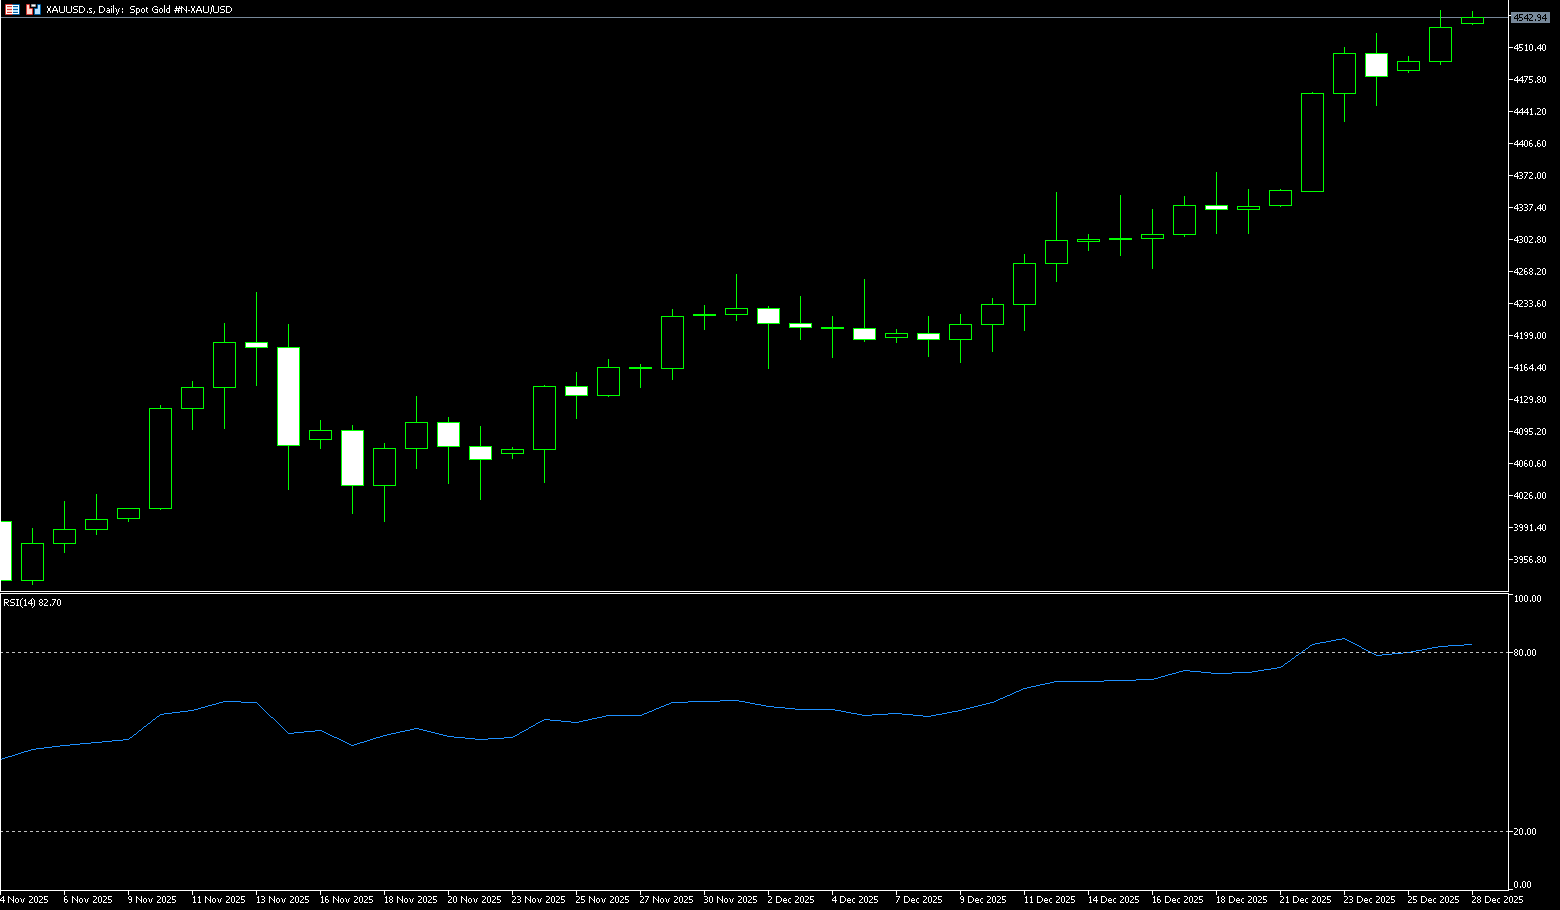
Gold prices surged again last week to a record high of $4,549.80 per ounce, driven by strong safe-haven demand amid escalating geopolitical tensions and market expectations of a US interest rate cut. Investors remain focused on the continued US blockade of Venezuelan oil exports, the ongoing hostility between Russia and Ukraine, and Washington's recent military strikes against ISIS in Nigeria. Meanwhile, the market continues to anticipate two quarterly interest rate cuts of 0.25 percentage points each by the Federal Reserve next year, driven by cooling inflation and a softening labor market, despite disagreements among Fed officials regarding the future path. Gold has risen over 70% year-to-date, its largest annual gain since 1979. Gold has experienced a phase of gold ETF selling, central bank buying, and then a combination of both. The phase of central bank buying and ETF selling propelled gold from $1,700 to $2,200 per ounce, while the subsequent combination of ETF and central bank buying pushed it from $2,200 to $4,550 per ounce. This surge was supported by strong central bank purchases and continued ETF inflows. At the same time, emerging market central banks benefit from accumulating gold as foreign exchange reserves, and countries like China and Japan, whose estimated gold reserves are relatively low compared to central bank averages, still have potential for gold allocation.
Last week, spot gold continued its long-term bull market, reaching a record high of $4,549.80 before fluctuating at high levels. Technically, it showed a divergence between short-term overbought and medium-term bullish trends, with low liquidity during the Christmas holiday amplifying volatility. At the beginning of the week, gold prices broke through the previous high of $4,381, driven by expectations of a Fed rate cut, geopolitical risk aversion, and central bank gold purchases, and touched a record high of $4,531 on Christmas Day. After reaching the high, due to year-end profit-taking and overbought correction, it quickly retreated to around $4,480 and fluctuated, but remained in a strong range overall. The 5/10/20-day moving averages are in a bullish alignment, and gold prices are running along the upper Bollinger Band, indicating a clear bullish medium-term trend. As for the technical indicators, the MACD has a golden cross above the zero axis and the red bars continue, indicating sufficient bullish momentum; the RSI (14) once rose to the overbought range of 81.30, indicating a need for indicator correction. Currently, gold prices show no clear reversal signals. The consolidation at higher levels is a normal digestion after the breakout, and a firm hold above the $4,400 level would solidify the bullish structure. Therefore, on the upside, after breaking through the key resistance level of $4,580 per ounce (corresponding to the 323.6% Fibonacci extension level of $3900 to $4526), spot gold has further upside potential to the $4,760 area (the 400% Fibonacci extension level). The ultimate target for 2026 is $5,000-$5,250. On the downside, the first support area is around $4,418.30 (the 5-day moving average) and the $4,400 psychological level. A break below these levels would challenge the $4,362 level (the 10-day moving average).
Consider going long on spot gold around 4,527 today; Stop loss: 4,523; Target: 4,560; 4,570
AUD/USD
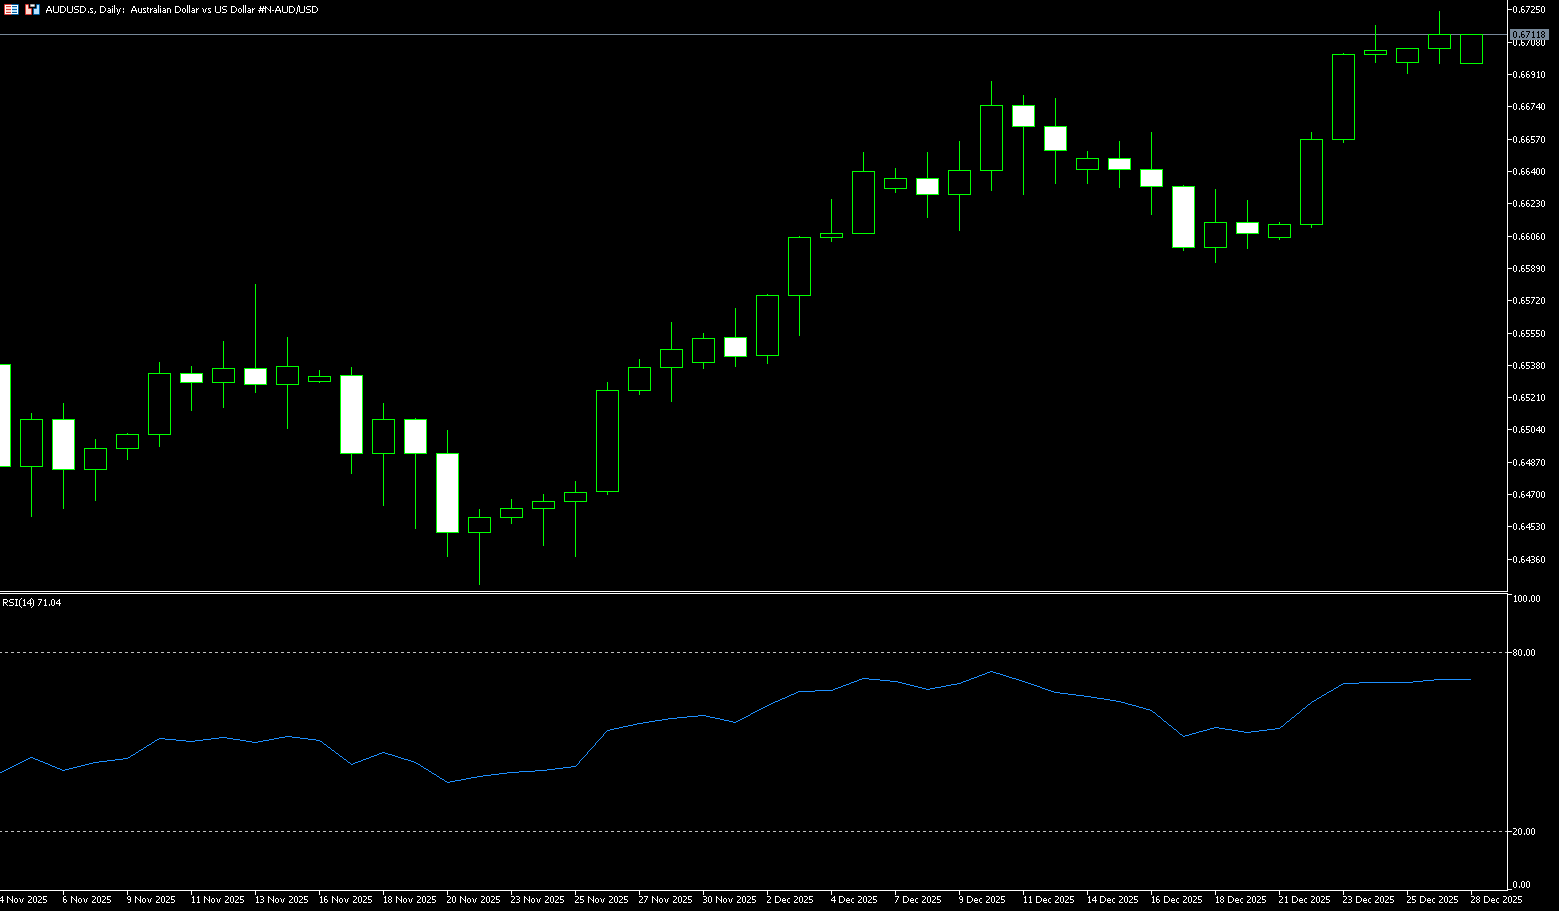
The Australian dollar climbed to around US$0.6724, its highest level since October last year, driven by market expectations of a rate hike by the Reserve Bank of Australia (RBA). The latest RBA meeting minutes showed that the board is prepared to tighten policy if inflation does not slow as expected, focusing on the fourth-quarter CPI report to be released on January 28. Analysts said that stronger-than-expected core inflation data in the fourth quarter could prompt the RBA to raise interest rates at its February 3 meeting. Although the market expects the central bank to keep policy unchanged until 2026, it is still weighing higher yields against the potential risk of policy tightening, with the market currently pricing in a 28% probability of a 25 basis point rate hike. The Australian dollar was supported by soaring commodity prices, with gold and copper prices hitting new highs, reflecting Australia's strong export structure. The currency also strengthened against the yen, reaching a 17-month high and rising nearly 7% so far this quarter. Meanwhile, the Australian dollar/US dollar exchange rate also rose as the US dollar (USD) faced challenges, fueled by growing market expectations that the Federal Reserve (Fed) will cut interest rates twice in 2026, an expectation supported by President Trump's calls to lower borrowing costs.
Last week, the Australian dollar/US dollar pair generally trended upwards, breaking through key levels and reaching a 14-month high of 0.6724 mid-week, maintaining its core bullish technical structure. Tight market liquidity during the Christmas holidays and thin trading volume made it susceptible to flash crashes or surges, increasing volatility but weakening trend continuity. The 5-day, 10-day, and 20-day moving averages on the daily chart are in a bullish alignment, with the exchange rate consistently above them. The RSI (14) technical momentum indicator is at a high of 69.73 but not overbought, indicating continued upward momentum. The MACD is above the zero line, and although the red bars have slightly contracted, the bullish momentum has not significantly weakened, and the bullish signal remains solid. This week's technical analysis confirmed the validity of the breakout above the 0.67 level, solidifying the medium-term upward channel. If the Australian dollar stabilizes above the 0.6700 (round number) - 0.6724 (14-month high) area after the holiday, the Australian dollar is expected to continue its upward trend against the US dollar, targeting 0.6785 (the high of October 4, 2024) and 0.6800 (a psychological level). If it retraces and breaks below 0.6685 (the high of December 10), the risk of a weakening medium-term trend to 0.6659 (the 9-day moving average) should be noted, with a break below that targeting the 0.6600 (psychological level) area.
Today, consider going long on the Australian dollar around 0.6702; Stop loss: 0.6690; Target: 0.6750; 0.6760
GBP/USD
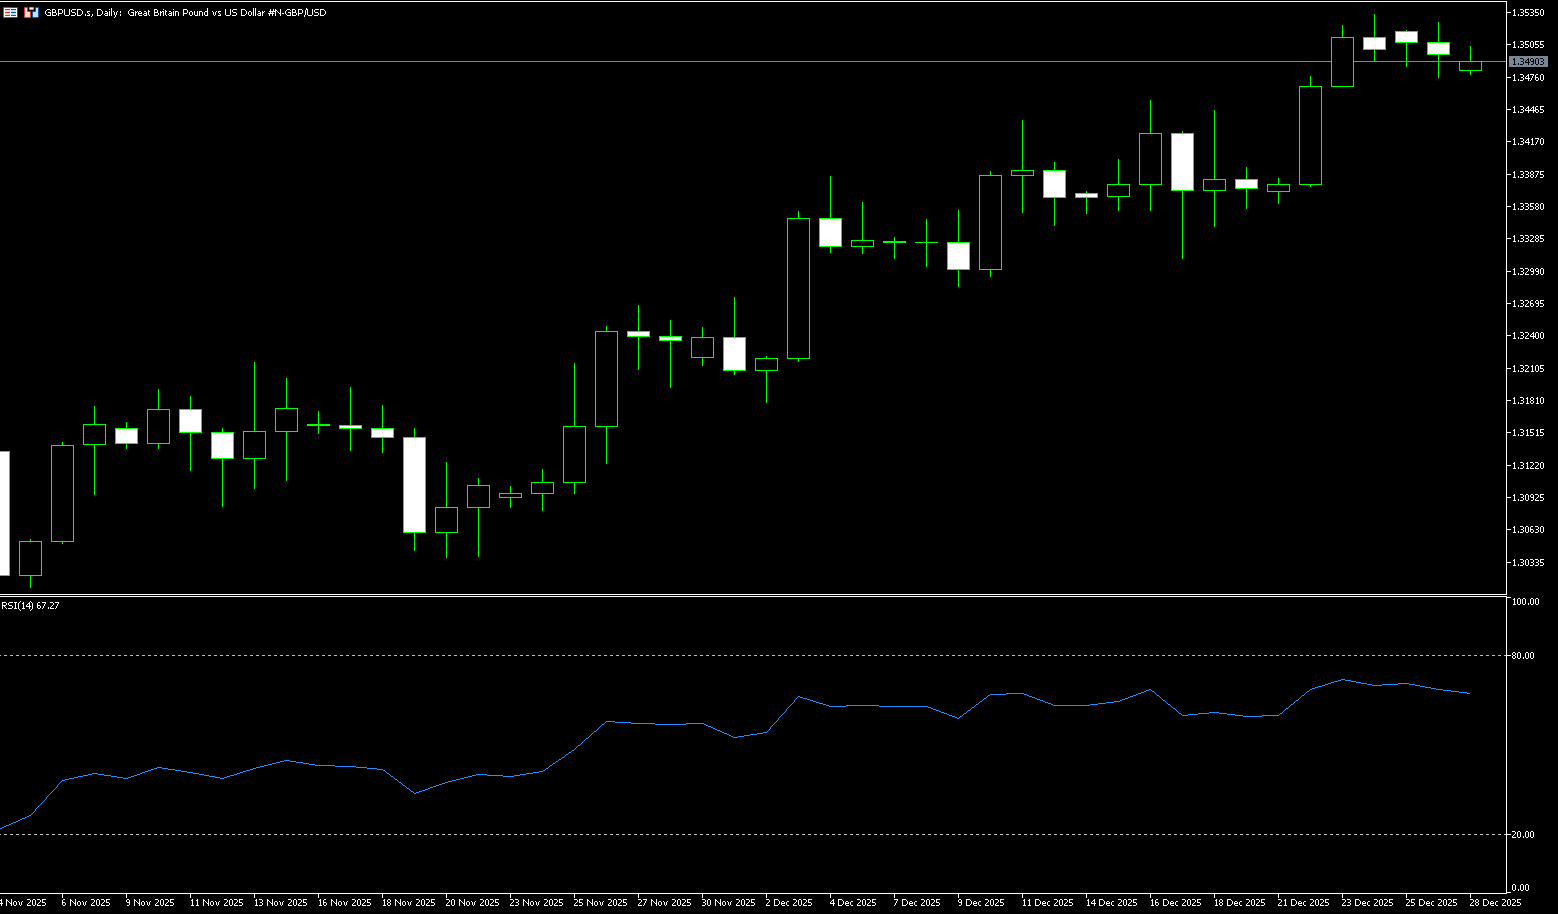
Last week, the pound/dollar pair generally trended upwards before undergoing a slight correction at higher levels, successfully breaking through the 1.35 level to reach an 11-week high. Currently, the market is in the midst of the Christmas holidays, resulting in relatively thin trading, which may amplify price volatility. From a fundamental perspective, the Bank of England decided on December 17th to cut its benchmark interest rate by 25 basis points to 3.75% by a 5-4 vote, marking the fourth rate cut this year, bringing the cumulative reduction to 100 basis points. Meanwhile, the Federal Reserve maintained a "wait-and-see" stance after three consecutive rate cuts. This divergence in monetary policy adds complexity to the pound/dollar exchange rate movement. On the one hand, the Bank of England's continued rate cuts put pressure on the pound; on the other hand, the Fed's cautious approach limited the dollar's rebound, providing some support for the pound. Furthermore, during the current holiday period, market liquidity is low, potentially weakening the impact of fundamental factors and making technical factors more prominent. Therefore, in-depth technical analysis is crucial for seizing current market opportunities.
The British pound experienced significant price action against the US dollar between September and December 2025. In September, the pair was in a clear downtrend, falling from a mid-September high of around 1.3726 to a November low of 1.3010. It then stabilized and rebounded, successfully breaking through the 200-day moving average (at 1.3322 at the time) to reach a high of 1.3535 last week. This breakout is considered a significant technical signal. From a daily chart perspective, the British pound is currently in an upward channel, with short-term moving averages (5-day, 10-day, and 20-day) showing a bullish alignment. This indicates an upward medium-term trend, with both short- and medium-term moving averages providing support. The 200-day moving average is particularly noteworthy. On December 3rd, the British pound successfully broke through the 200-day moving average (1.3321), a breakout considered a crucial signal indicating a potential bullish or bearish trend. The MACD indicator suggests that the upward momentum of the pound against the dollar remains strong, with bulls dominating. Meanwhile, the RSI (14) is currently near 70, indicating that the market's upward momentum is neither overheated nor in a healthy state. Technically, the pound against the dollar is currently in an uptrend. The first resistance level to watch is the 1.3560 (September 19 high) – 1.3600 level. A successful break and hold above this level would open up further upside potential to 1.3726 (September 17 high). On the downside, watch 1.3446 (9-day moving average); a break below this level would lead to a pullback to 1.3400 (psychological level).
Today, consider going long on the pound near 1.3490; stop loss: 1.3478; target: 1.3540; 1.3550
USD/JPY
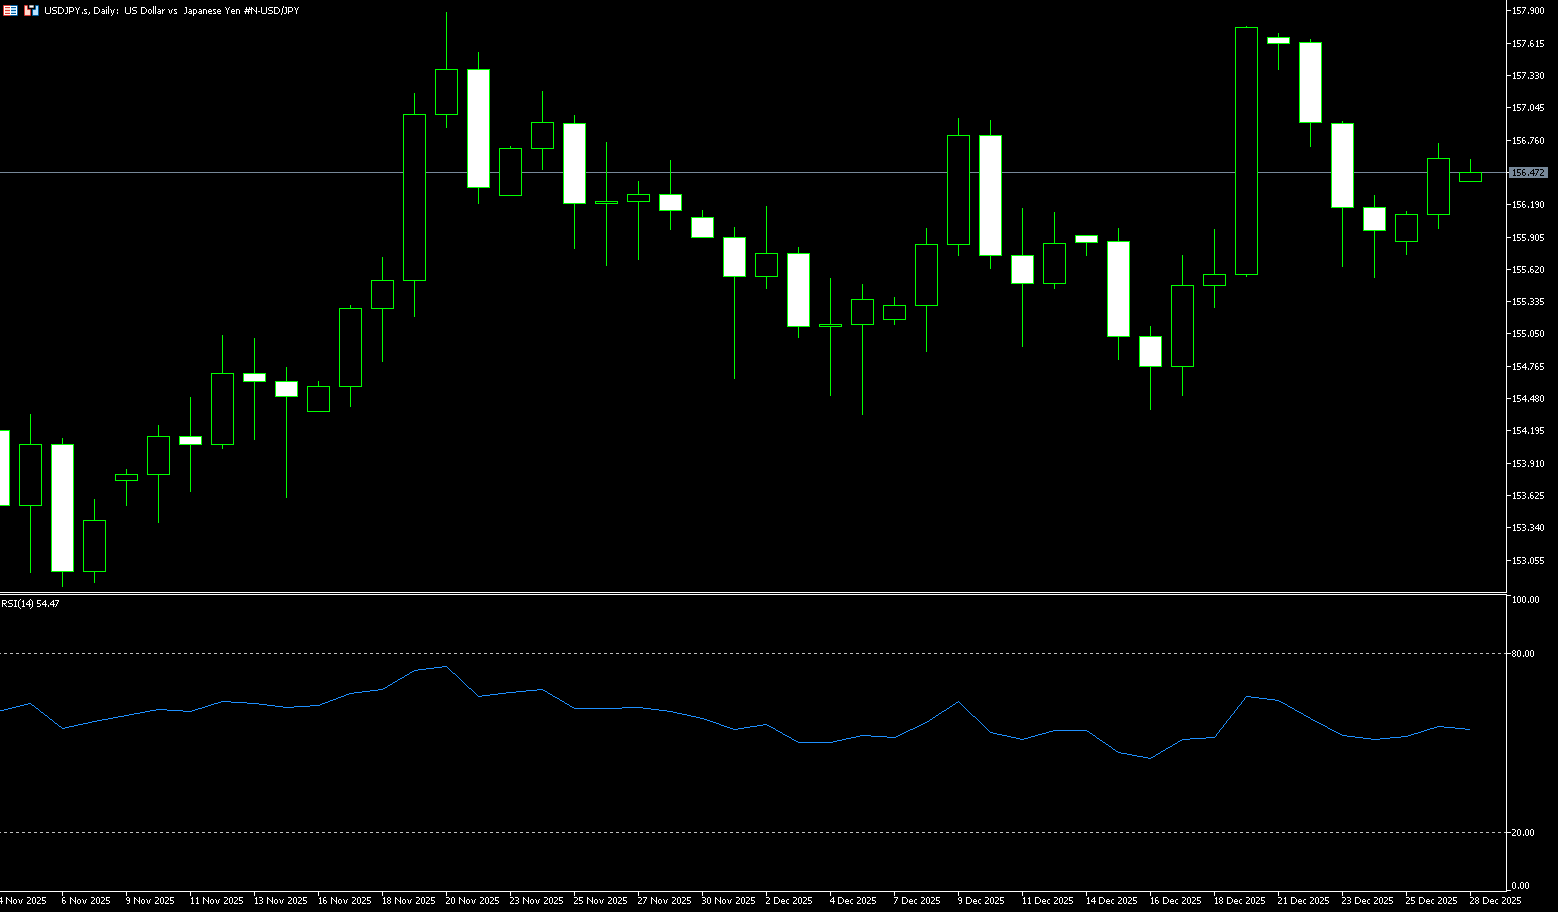
The USD/JPY pair exhibited a generally downward trend last week. At the beginning of the week, the exchange rate fluctuated narrowly within the 155.5-156.0 range, with market sentiment relatively cautious. Mid-week, bullish forces began to gain momentum, and the exchange rate successfully broke through the key resistance level of 156.0, subsequently initiating an upward trend. During the Asian session on Thursday and Friday, the USD/JPY pair continued its upward trend, reaching a high of 156.40. From the daily candlestick chart, the USD/JPY pair closed with a bullish candle with a small upper shadow this week, indicating that while bulls were in control, there was significant selling pressure above. This movement reflects the interplay of multiple factors. On one hand, the hawkish signals released by the Federal Reserve at its December meeting suggested a possible reduction in rate cuts in 2025, supporting the relative strength of the US dollar. On the other hand, although the Bank of Japan kept interest rates unchanged at its December 19 meeting, market expectations for a rate hike in January or March 2025 remain, providing some support for the yen. Furthermore, the relatively low market liquidity near the end of the year also exacerbated exchange rate volatility. On the other hand, Governor Uda hinted at a possible further interest rate hike if inflation persists. Despite this, the yen remains near its January lows, raising warnings of potential market intervention. Meanwhile, the cabinet approved the draft budget for fiscal year 2026, with total account spending reaching a record high of approximately 122 trillion yen. This marks the first budget under the Takashi City government and is scheduled to be submitted to the Diet in January.
Last week, the USD/JPY pair exhibited a pattern of "rising to resistance – then oscillating and correcting," retreating from a double top near 157.90 during the week, with the center of gravity shifting down to the 155.56-156.50 range. While the short-term bias is bearish, the medium-term bullish structure remains intact, with key support and resistance levels clearly defined. Technically, the bullish structure is gradually consolidating. Looking at the daily chart, a double top pattern formed at 157.90, with the neckline around 157.00. A break below this level would target 155.50-155.00. The levels of 155.56 and 155.54 have transformed from previous resistance into important support levels. This area not only represents last week's low but also receives strong support from the 40-day moving average. If these support levels are breached, the price could fall back to the 155.00 level. If 154.65 is breached, the medium-term bullish trend may be broken. The levels of 154.35 (the low of December 5th) and 154.38 (the 60-day moving average) will become key dividing lines between bullish and bearish trends; a break below these levels could trigger a larger pullback. As for the RSI (14) indicator, it has fallen from around 63 to near the neutral line of 53; a break below this level would indicate further downside. The MACD has formed a death cross above the zero line, with the red momentum bars shrinking, indicating weakening upward momentum but not yet fully turning negative. On the other hand, if the small double top resistance at 156.94-156.96 holds, the next levels to watch are 157.89 (November 20 high) and 158.00 (psychological level). A break above these levels would target 158.88 (January high).
Today, consider shorting the US dollar near 156.70; stop loss: 156.95; target: 155.80; 155.50
EUR/USD
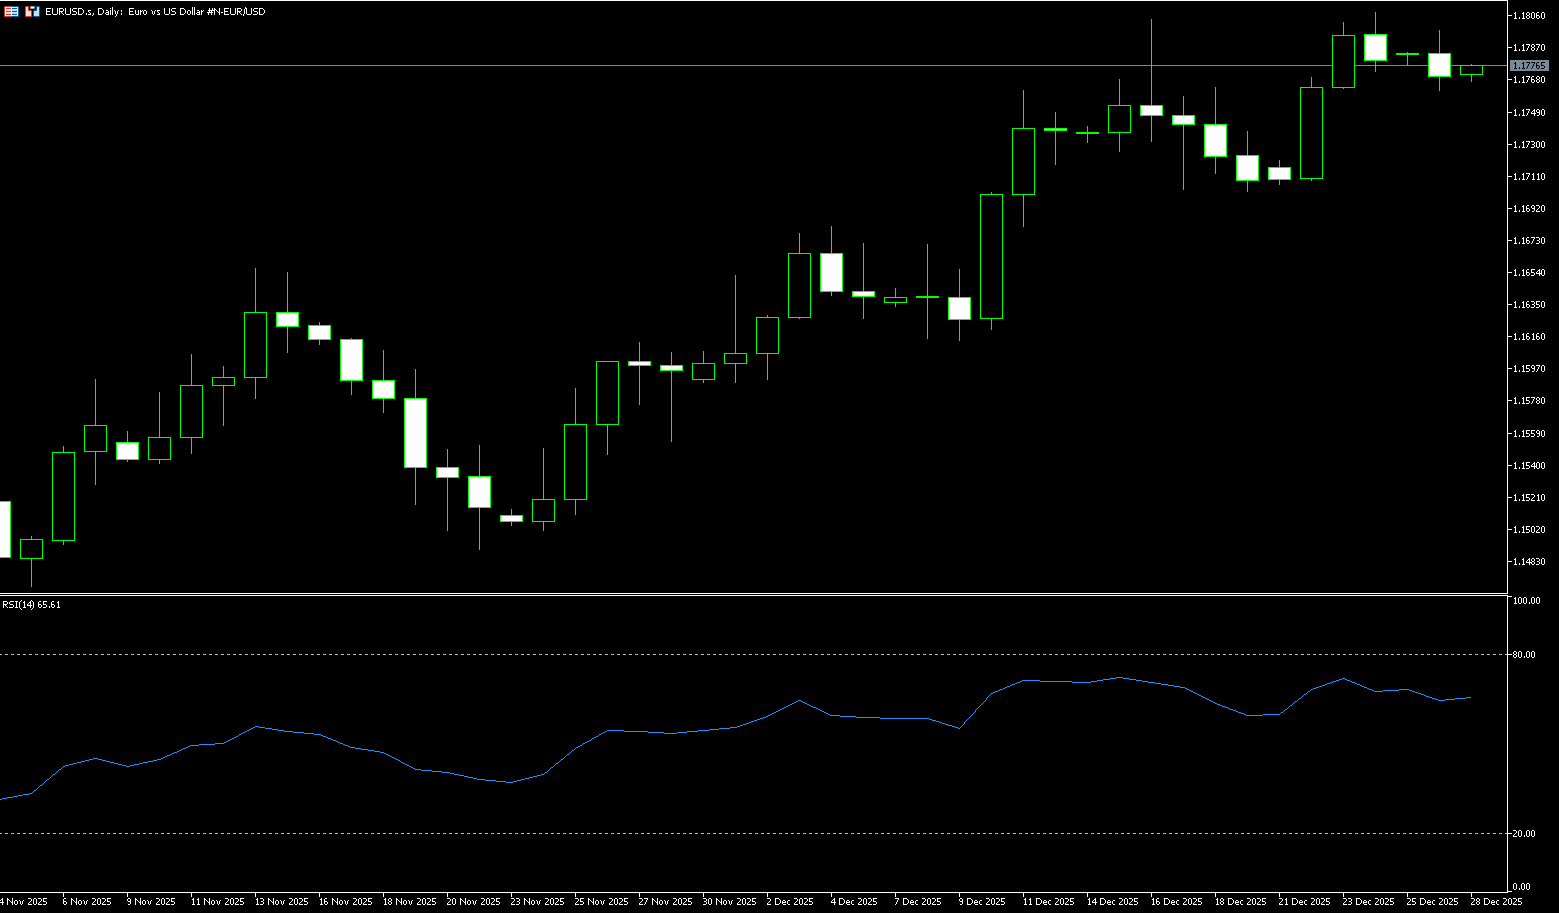
The EUR/USD exchange rate exhibited typical Christmas holiday trading volume last week, maintaining a narrow range of 1.17-1.18. The pair reached a high of 1.1808 and a low of 1.1706 during the week, with a weekly range of only about 102 pips, in line with market expectations for the Christmas holiday. Fundamentally, the divergence in monetary policies between the US and Europe remains the core driving factor. The European Central Bank (ECB) kept its three key interest rates unchanged on December 18: the deposit facility rate at 2.00%, the main refinancing rate at 2.15%, and the marginal lending rate at 2.40%, marking the sixth consecutive day of holding rates steady. The Federal Reserve has cut interest rates by a cumulative 75 basis points to a range of 3.5%-3.75% by 2025, but internal divisions have intensified, narrowing expectations for rate cuts in 2026. US Q3 GDP growth of 4.3% exceeded expectations, but non-farm payrolls increased by only 64,000 in November, and the unemployment rate rose to 4.6%, revealing structural contradictions in economic data. Looking at economic forecasts, the ECB holds a cautiously optimistic view of inflation and growth prospects for the next few years. The latest forecast shows that the overall inflation rate in the Eurozone will be 1.9% in 2026. Regarding economic growth, the Eurozone economy is projected to grow by 1.4% in 2025, higher than previously expected; and by 1.2% in 2026. Internal divisions within the Federal Reserve's policy are widening: in stark contrast to the ECB's prudent approach, the Fed's policy path is fraught with uncertainty. Expectations for a rate cut in 2026 are narrowing. Unless the central bank continues to lower interest rates next year, the US faces the risk of a recession.
Against the backdrop of divergent monetary policies between the US and Europe, the euro has a basis for further upward movement. Technically, the exchange rate has stabilized above its medium- and long-term moving averages, with the 5-day, 10-day, and 20-day moving averages maintaining a bullish alignment. According to real-time tracking from multiple data sources, the EUR/USD RSI (14) indicator has indeed remained within the 65-70 range. The assessment is that the pair is in a neutral-to-strong but not overbought condition. The MACD indicator also aligns closely with the technical analysis, showing a more positive signal. This indicates that bullish momentum is dominant, but after reaching a high level, it needs "continued upward movement" to extend the trend. The bullish alignment of the moving average system is perfectly validated. The Euro/USD pair has consistently held above the 5-day, 10-day, and 20-day moving averages, forming a standard bullish pattern. The bullish bias remains. The 1.1800-1.1808 resistance zone, which is a key focus in technical analysis, indeed constitutes a major obstacle to the Euro/USD's upward movement. From a technical structure perspective, this area has multiple technical implications. First, 1.1800 is an important psychological level with natural resistance. Second, 1.1808 is the recent high reached on December 16th, representing a previous high resistance level, creating a superposition of multiple resistance levels. A break below this level would target 1.1850, which is the upper boundary of the upward channel. This area also represents a significant previous high. Further support is seen at 1.1918 (the high of September 17th). The support level system mentioned in the technical analysis has also been validated. 1.1740 serves as a key support level, acting as both the 14-day moving average and a potential break below this level that could trigger short-term profit-taking for bulls. Deeper support lies in the 1.1720-1.1702 range, which forms the structural support base for this upward trend.
Today, consider going long on the Euro near 1.1762; Stop-loss: 1.1750; Target: 1.1810; 1.1820
Disclaimer: The information contained herein (1) is proprietary to BCR and/or its content providers; (2) may not be copied or distributed; (3) is not warranted to be accurate, complete or timely; and, (4) does not constitute advice or a recommendation by BCR or its content providers in respect of the investment in financial instruments. Neither BCR or its content providers are responsible for any damages or losses arising from any use of this information. Past performance is no guarantee of future results.
Lebih Liputan


Pendedahan Risiko:Instrumen derivatif diniagakan di luar bursa dengan margin, yang bermakna ia membawa tahap risiko yang tinggi dan terdapat kemungkinan anda boleh kehilangan seluruh pelaburan anda. Produk-produk ini tidak sesuai untuk semua pelabur. Pastikan anda memahami sepenuhnya risiko dan pertimbangkan dengan teliti keadaan kewangan dan pengalaman dagangan anda sebelum berdagang. Cari nasihat kewangan bebas jika perlu sebelum membuka akaun dengan BCR.
BCR Co Pty Ltd (No. Syarikat 1975046) ialah syarikat yang diperbadankan di bawah undang-undang British Virgin Islands, dengan pejabat berdaftar di Trident Chambers, Wickham’s Cay 1, Road Town, Tortola, British Virgin Islands, dan dilesenkan serta dikawal selia oleh Suruhanjaya Perkhidmatan Kewangan British Virgin Islands di bawah Lesen No. SIBA/L/19/1122.
Open Bridge Limited (No. Syarikat 16701394) ialah syarikat yang diperbadankan di bawah Akta Syarikat 2006 dan berdaftar di England dan Wales, dengan alamat berdaftar di Kemp House, 160 City Road, London, City Road, London, England, EC1V 2NX. Entiti ini bertindak semata-mata sebagai pemproses pembayaran dan tidak menyediakan sebarang perkhidmatan perdagangan atau pelaburan.

 English
 简体中文
简体中文
 繁體中文
繁體中文
 Bahasa
Melayu
Bahasa
Melayu
 Tiếng
Việt
Tiếng
Việt
 ไทย
ไทย
 日本語
日本語
 한국어
한국어
 ភាសាខ្មែរ
 español