


0
US Dollar Index
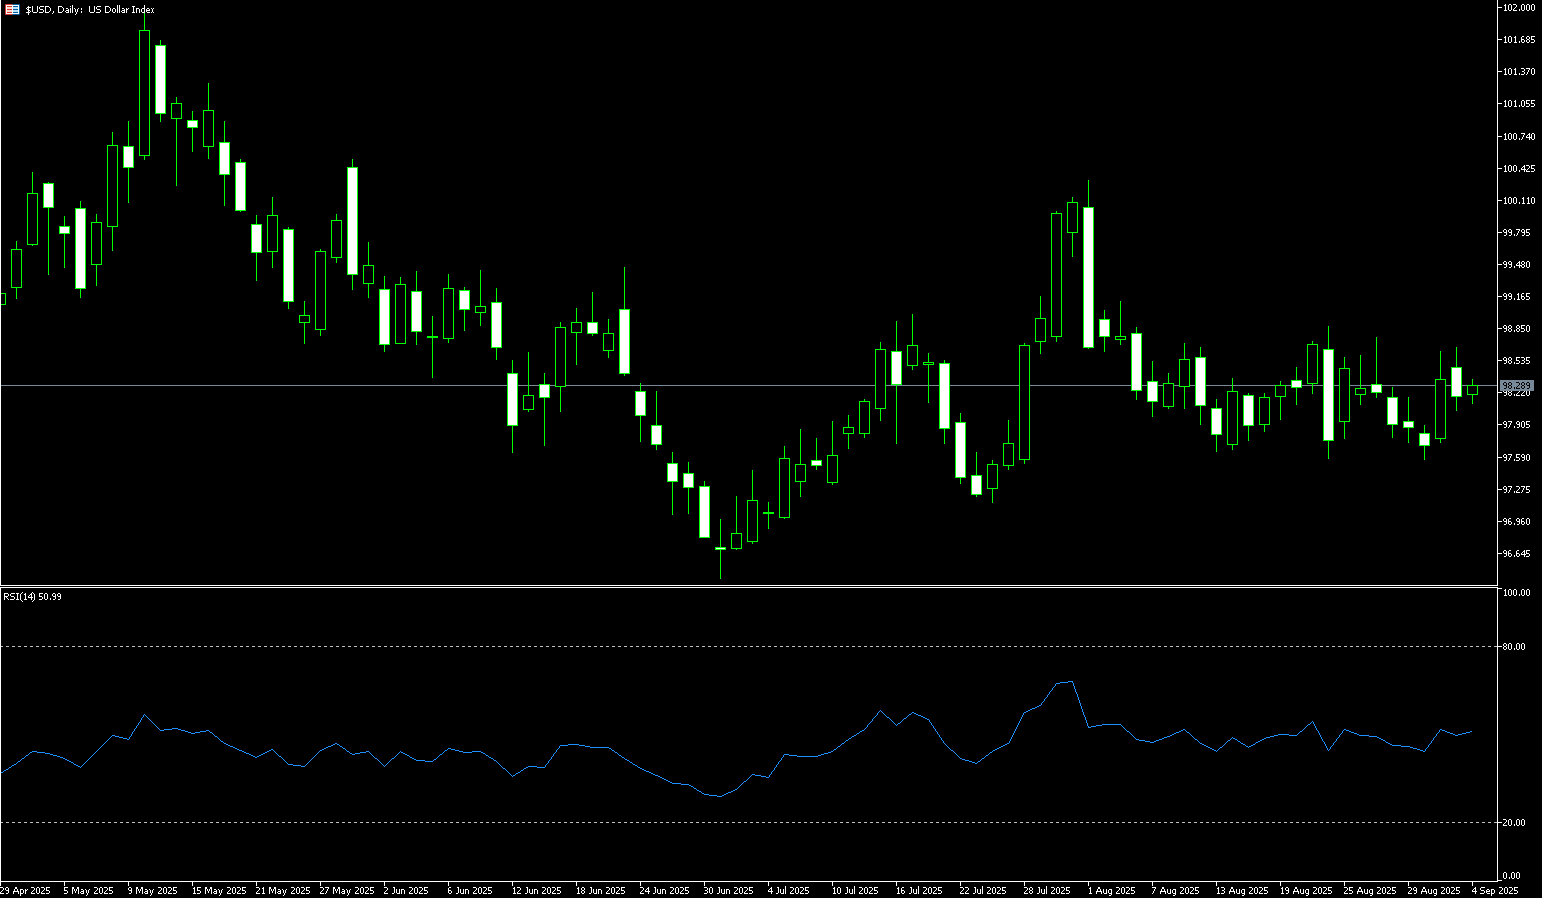
The US dollar index hovered above 97.30 on Thursday after a sharp rebound in the previous session, as investors reassessed the Federal Reserve's policy outlook. On Wednesday, the Fed implemented its widely expected quarter-point interest rate cut, while hinting at two more rate cuts this year but only one in 2026, defying market expectations of two or three cuts next year. Chair Jerome Powell struck a cautious tone, framing the move as "risk management" and emphasizing the need for a rush to ease policy. Notably, newly appointed Governor Stephen Milan was the lone dissenter, supporting a larger 50 basis point rate cut, resulting in less divergence than expected. Separately, the Bank of Canada also cut its interest rate by 25 basis points, while the Bank of England and the Bank of Japan are expected to keep their policies unchanged this week.
Following the Fed's widely expected quarter-point rate cut, the US dollar index rebounded sharply and is now trading above 97.00. Technical analysis on the daily chart shows that the US dollar index remains consolidating within a descending channel pattern, indicating a dominant bearish bias. The 14-day Relative Strength Index (RSI) is near 46, further reinforcing the bearish bias. Furthermore, as the US Dollar Index remains below its 9-day simple moving average at 97.40, short-term price momentum is weak. On the downside, the US Dollar Index could find immediate support at 96.55 (September 16 low), followed by 96.38, the lowest point since February 2022, reached on July 1. Furthermore, the US Dollar Index could find major resistance at its 9-day simple moving average at 97.40. A break above this level would improve short-term price momentum and support the US Dollar Index's move towards its 20-day simple moving average at 97.75.
Consider shorting the US Dollar Index at 97.50 today, with a stop loss at 97.60 and a target of 97.00 or 96.90.
WTI Spot Crude Oil
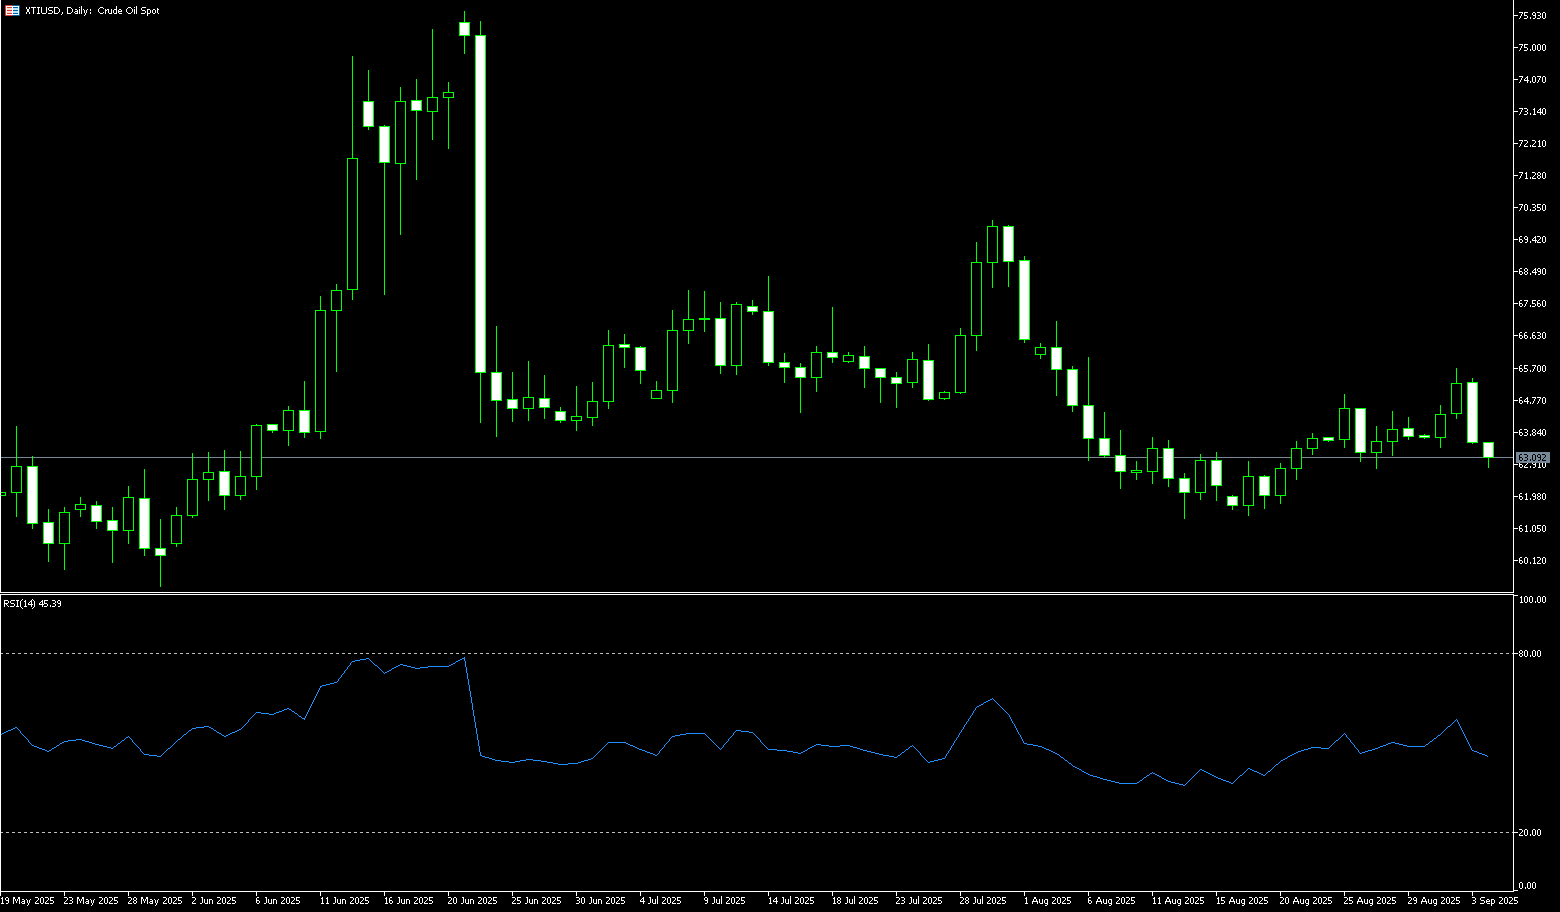
WTI crude oil futures fell below $63.50 per barrel on Thursday, extending losses from the previous session as traders continued to assess US inventory data and the Federal Reserve's rate cut. EIA data showed a 9.3 million barrel drop in crude oil inventories last week, driven primarily by a sharp increase in exports. However, a surge in adjustments and a climb in distillate inventories to their highest level since January cast a pessimistic tone on the report. Meanwhile, the US Federal Reserve cut interest rates by 25 basis points, as expected, and hinted at further cuts to support a weakening job market. However, despite this dovish shift, the market remains cautious, as it could also signal growing economic risks for major oil-consuming nations. Investors also remain concerned about Russian oil supply concerns following recent intensified attacks on energy facilities in Ukraine.
Overall, the Fed's rate cut provided some support to oil prices, but an unexpected increase in US refined product inventories suggests volatility in downstream demand. Going forward, oil prices will continue to find a balance between "expectations of policy easing boosting expectations" and "inventory and supply pressures." Looking at the daily chart, US crude oil prices are finding temporary support around $63.50. Key short-term support lies at $63.00 and the 9-day simple moving average of $62.99. A break below this level could lead to further declines to $62.28, this week's low. Above, resistance lies at the 100-day simple moving average of $64.27. A break above this level could challenge $65.00 and $65.61, the 50.0% Fibonacci retracement level from $70.02 to $61.20.
Consider going long on crude oil at 63.14 today. Stop loss: 63.00, target: 64.40, 64.60.
Spot Gold
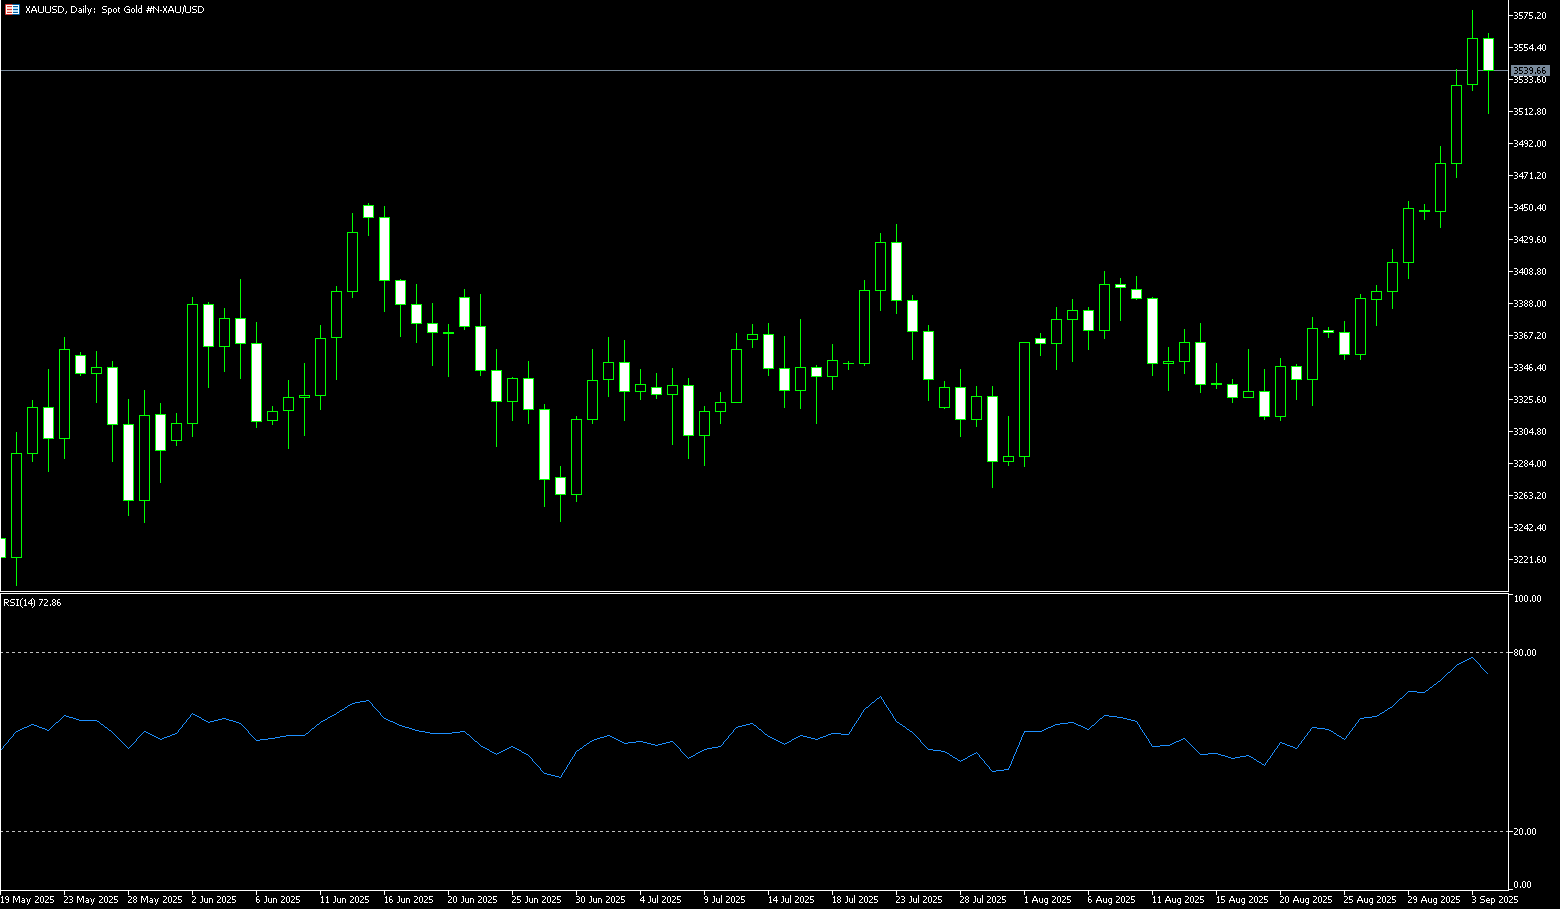
Gold briefly hovered as low as $3,628 per ounce on Thursday, holding onto losses from the previous session. The US dollar strengthened following the Federal Reserve's policy decision. The Fed cut interest rates by 25 basis points, as expected, and indicated that borrowing costs could gradually decline over the rest of the year. The price has rebounded to around $3,660. However, Fed Chairman Powell struck a cautious tone about further easing, describing the move as a risk management measure for a sluggish labor market. He added that the central bank will take a "meeting-by-meeting" approach to assessing the future path of interest rates. Gold has risen 39% year-to-date, supported by expectations of Fed easing, ongoing geopolitical tensions, and strong central bank demand. Elsewhere, the supply of secondhand gold jewelry and coins in India remains limited, leading investors to hold onto gold bars in anticipation of further price increases despite the weekly record high.
Gold prices hit a record high of $3,707.70 per ounce on Wednesday, but a rebound in the US dollar caused a sharp and swift decline. Currently hovering around $3,647, bullish momentum remains. After a period of sideways trading, the precious metal may still have the momentum to challenge its all-time high again, with upside targets at $3,750 and $3,800. The 14-day Relative Strength Index (RSI) continues to flash overbought signals, suggesting limited short-term upside, but the overall trend remains bullish. If a Fed rally, characterized by "buy the anticipation, sell the reality," triggers a further pullback in gold prices, the primary support level lies at $3,628 (Thursday's low). A break below this level would raise the September 11 low of $3,613 to the next target, just above the psychologically important $3,600 level.
Consider going long on gold at 3,643 today, with a stop-loss at 3,638 and targets at 3,665 and 3,670.
AUD/USD
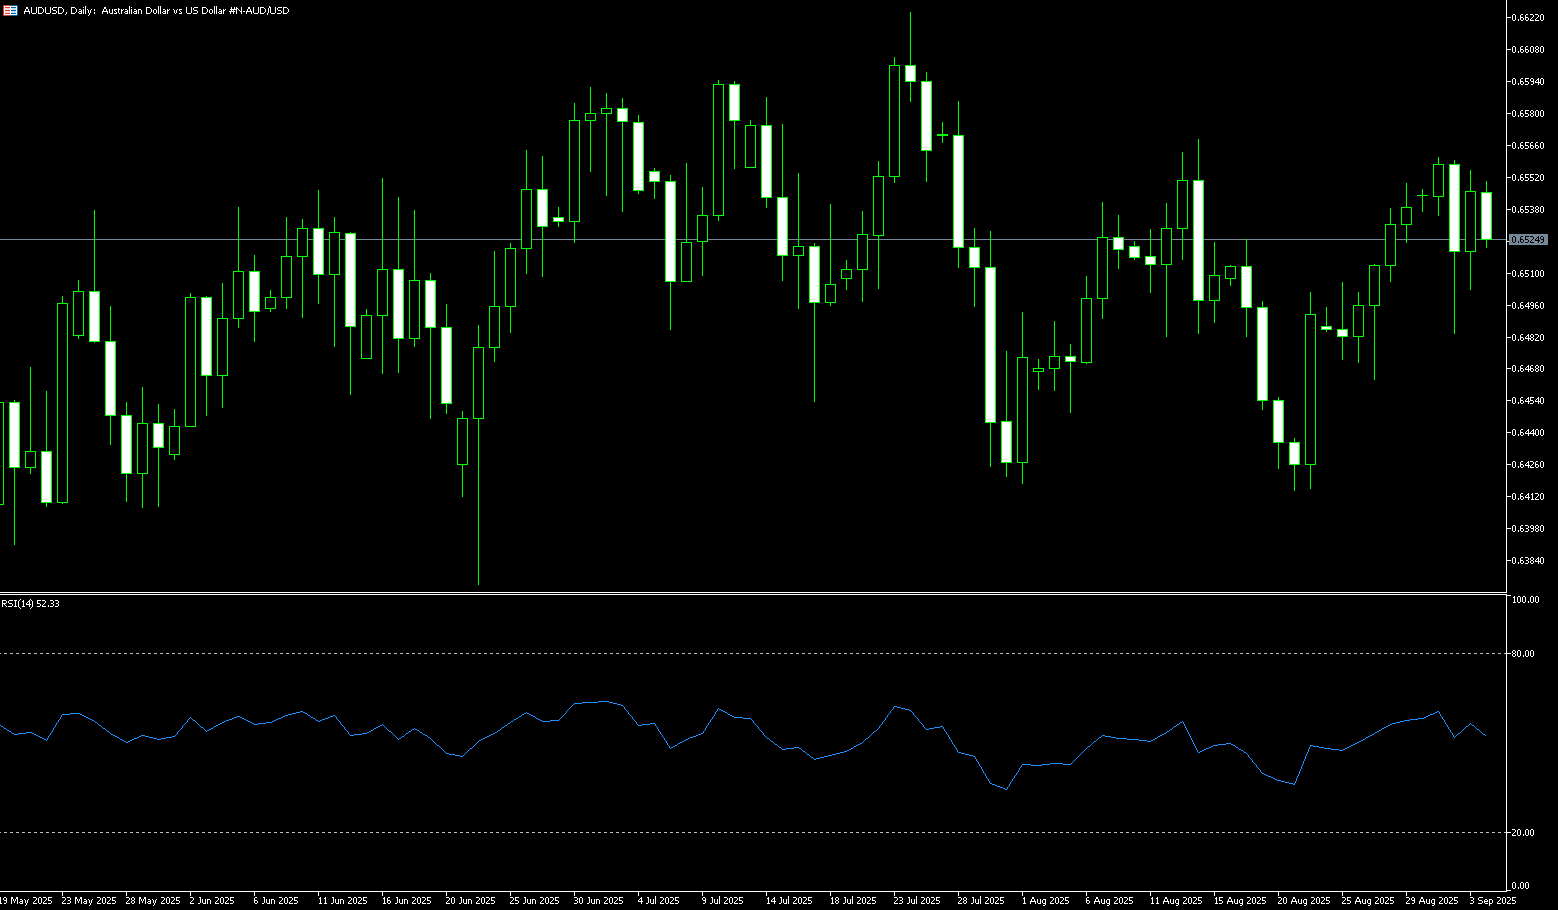
The Australian dollar traded around $0.6615 on Thursday, holding onto losses from the previous session as markets digested a weaker-than-expected domestic employment report. The pair also came under pressure as strong inflation expectations supported the US dollar, dampening expectations for a more aggressive Federal Open Market Committee rate cut. Data showed that net employment fell by 5,400 in August, compared to expectations for a 21,500 increase, driven by a sharp drop of 40,900 full-time positions. The unemployment rate remained stable at 4.2%, while the participation rate fell to 66.8%, indicating gradual softening in the labor market. Despite the weak data, markets are only pricing in a 20% chance of a rate cut by the Reserve Bank of Australia at its September 30 meeting, with expectations rising to 70% in November. Policymakers are expressing caution as inflation remains above target.
AUD/USD traded around 0.6615 on Thursday. Technical analysis on the daily chart suggests that the pair, while temporarily under pressure, remains in an upward trend within a rising channel, reinforcing the bullish outlook. Short-term momentum remains strong, with the price holding above the 14-day simple moving average at 0.6601 and the psychological level of 0.6600. On the upside, the pair could target the 0.6700 round-figure mark, followed by the 11-month high of 0.6703 reached on September 17. A break above this level would lead to a test of 0.6742, the high of October 10, 2024. On the other hand, AUD/USD could find initial support at the 14-day simple moving average at 0.6601 and the psychological level of 0.6600, followed by the 20-day simple moving average around 0.6572. A break below this channel would weaken the bullish bias.
Consider going long on the Australian dollar at 0.6600 today, with a stop-loss at 0.6590 and targets at 0.6650 and 0.6660.
GBP/USD
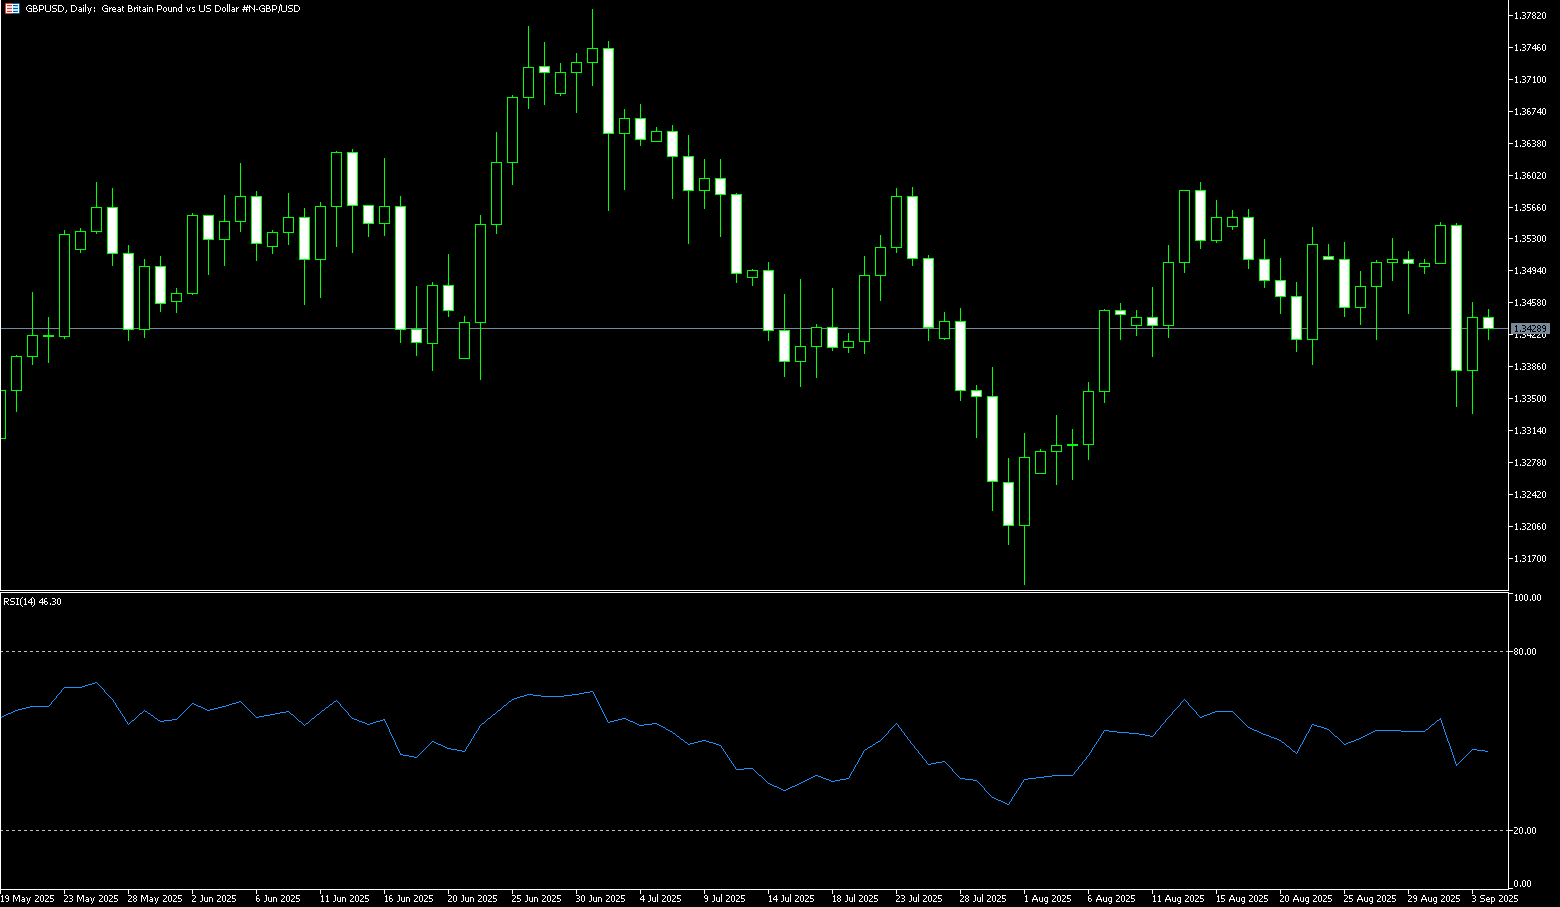
On Thursday, the British pound fell after the Bank of England held its bank rate at 4% and tapered quantitative tightening, sliding back to around 1.3550 amidst a divergence from the Federal Reserve's easing cycle. The Fed decided to cut interest rates by 25 basis points at its September meeting on Wednesday, its first rate cut of the year. Fed Chairman Powell stated that Wednesday's rate cut was motivated by risk management, adding that he did not see a need for a rapid rate adjustment. This comment provided some support for the US dollar and created resistance for major currency pairs. On Friday, market attention will turn to UK retail sales data for August. Total retail sales are expected to rise by 0.4% month-over-month, while retail sales excluding fuel are projected to rise by 0.3% during the same period. If the results are better than expected, this could boost the British pound in the short term.
From this week's technical perspective, GBP/USD remains in a correction phase from its over two-month high of 1.3726. The 14-day Relative Strength Index (RSI) on the daily chart remains comfortably above 50, currently nearing 58.50, suggesting that upside risks remain in the short term. However, buyers need to see acceptance above the psychological level of 1.3700 for a sustained uptrend. The next resistance lies at the previous day's high of 1.3726 and the July high of 1.3789. On the downside, the 20-day simple moving average of 1.3522 may provide immediate support. Further downside, the 1.3500 round number will provide support for GBP buyers. A deeper decline could threaten the convergence support near the 50-day simple moving average of 1.3465.
Consider going long on the British pound at 1.3540 today. Stop-loss: 1.3526. Target: 1.3600, 1.3610.
USD/JPY
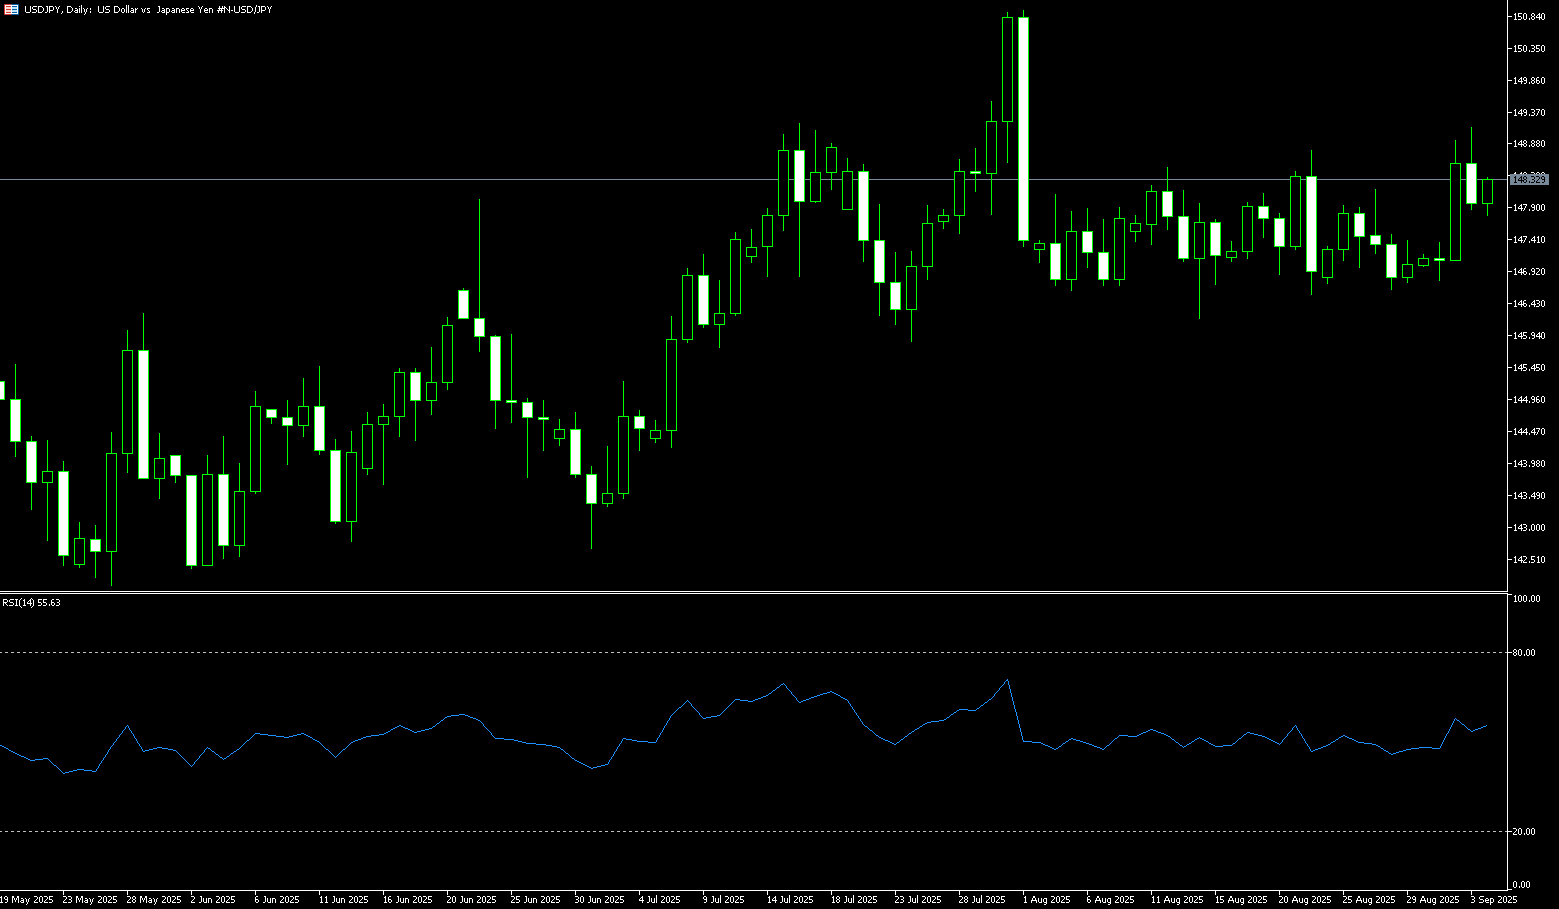
The yen fell below 147.00 against the dollar on Thursday, retreating from a two-month high reached the previous session as the greenback strengthened following the Federal Reserve's latest policy decision. On Wednesday, the Fed delivered the widely expected quarter-point rate cut while signaling two more cuts this year but only one in 2026, defying expectations of two or three rate cuts next year. Domestically, the Bank of Japan began its two-day policy meeting, with interest rates expected to remain unchanged as officials assess the impact of US tariffs on Japan's export-driven economy. Nevertheless, analysts suggest the BOJ is likely to raise interest rates by 25 basis points in October given the strong economic performance. Politically, the ruling Liberal Democratic Party will elect a new leader on October 4 to succeed outgoing Prime Minister Shigeru Ishiba.
USD/JPY's break below the 146.30-146.20 support level on Wednesday is now being categorized as a "false breakout," due to the post-FOMC meeting reversal and the subsequent strength following Thursday's breakout above the 147.00 level. However, oscillators on the daily chart have yet to confirm the positive outlook, suggesting the pair may face strong resistance at the psychological level of 148.00. A sustained, strong break above this resistance level could push the spot price to 148.50, potentially challenging the 200-day simple moving average, currently located in the 148.67 area, and potentially the 149.00 level. On the other hand, any meaningful decline could find some support around the 146.70 area. A decisive break below the latter would expose the 146.28 low (Wednesday's low), below which USD/JPY could accelerate its decline and challenge the psychological level of 146.00.
Consider shorting the US dollar at 148.20 today. Stop-loss: 148.40, target: 147.20, 147.00.
EUR/USD
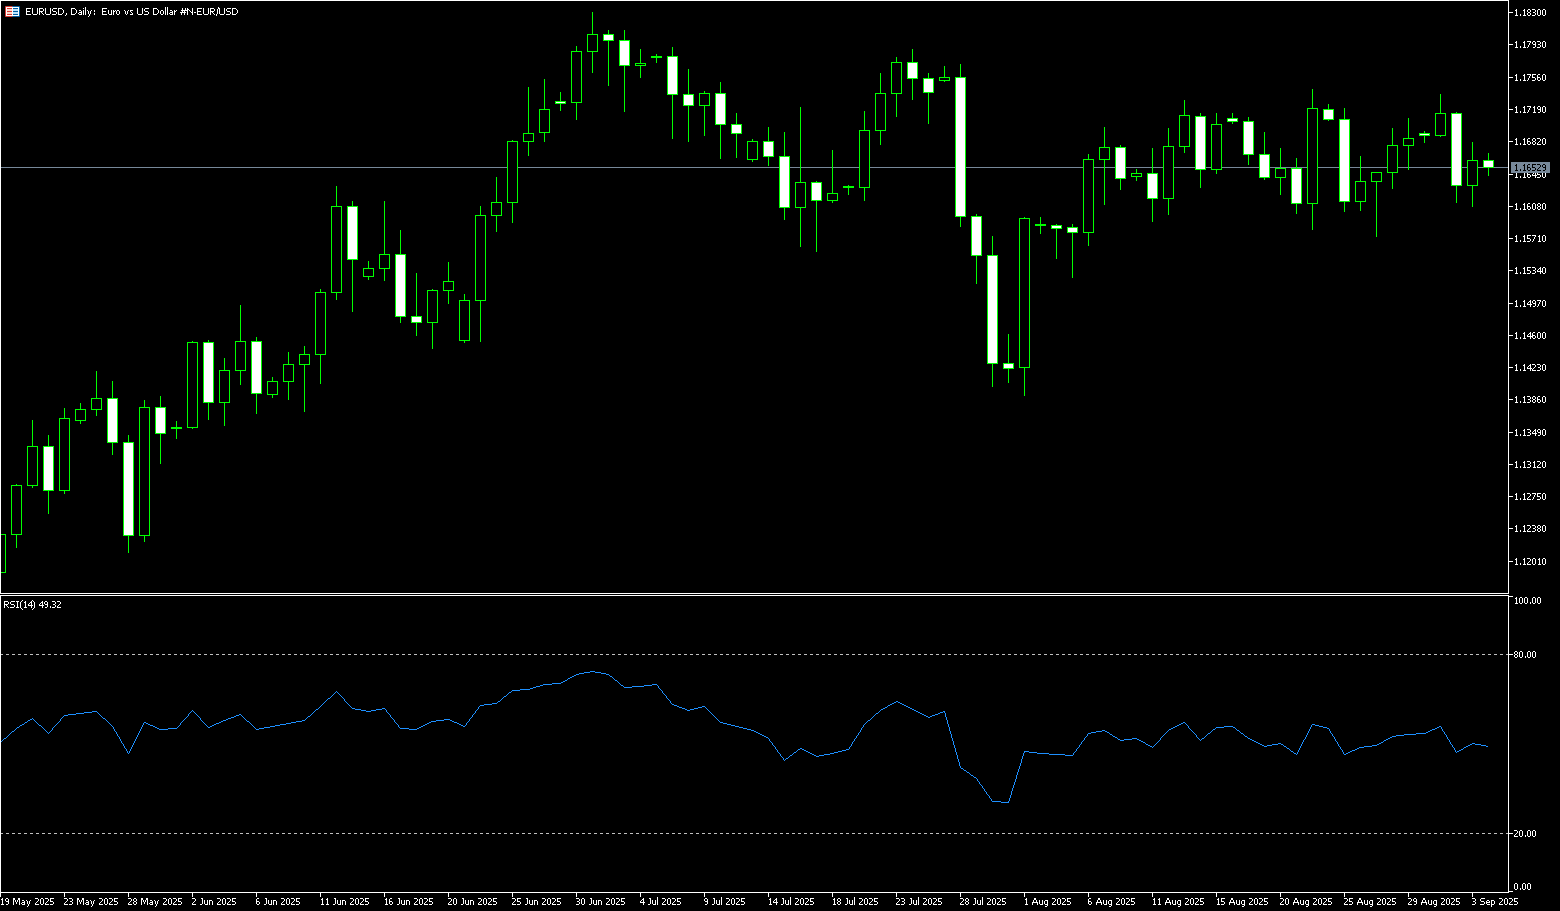
During Thursday's trading session, EUR/USD briefly dipped below 1.1800 before stabilizing. Earlier, the dollar fell to a 3.5-year low of 1.1919. The Federal Reserve cut interest rates by 25 basis points at its September meeting on Wednesday, as expected, and signaled a steady reduction in borrowing costs for the remainder of the year. Fed Chairman Powell characterized the recent policy decision as a risk-management response to a weak labor market, but stressed that the US central bank does not need to rush to ease policy. Powell's comments were less dovish than expected and may provide some short-term support for the US dollar. Across the Atlantic, the latest inflation data supported the European Central Bank's decision to keep interest rates unchanged at its recent meeting. Rising expectations that the ECB has completed its rate cuts may support the euro against the US dollar.
EUR/USD briefly jumped to a four-year high of 1.1919 midweek in reaction. However, Federal Reserve Chairman Powell warned in his press conference following the rate cut that the Fed is still monitoring individual data releases and cautioned that the SEP is not on a "predetermined trajectory." EUR/USD plummeted to consolidate below 1.1800. However, the 14-day Relative Strength Index (RSI) on the daily chart supports further upside, remaining below overbought territory (currently near 66). A failure to reclaim the psychological 1.1800 level would expose the 14-day simple moving average at 1.1732, further pointing to the 1.1700 level. On the upside, a re-test of 1.1800 would bring the previous yearly high of 1.1830 and 1.1919 (Wednesday's high) into focus.
Consider a long EUR at 1.1773 today, with a stop-loss at 1.1760 and targets at 1.1840 and 1.1850.
Disclaimer: The information contained herein (1) is proprietary to BCR and/or its content providers; (2) may not be copied or distributed; (3) is not warranted to be accurate, complete or timely; and, (4) does not constitute advice or a recommendation by BCR or its content providers in respect of the investment in financial instruments. Neither BCR or its content providers are responsible for any damages or losses arising from any use of this information. Past performance is no guarantee of future results.
Lebih Liputan


Pendedahan Risiko:Instrumen derivatif diniagakan di luar bursa dengan margin, yang bermakna ia membawa tahap risiko yang tinggi dan terdapat kemungkinan anda boleh kehilangan seluruh pelaburan anda. Produk-produk ini tidak sesuai untuk semua pelabur. Pastikan anda memahami sepenuhnya risiko dan pertimbangkan dengan teliti keadaan kewangan dan pengalaman dagangan anda sebelum berdagang. Cari nasihat kewangan bebas jika perlu sebelum membuka akaun dengan BCR.

 English
 简体中文
简体中文
 繁體中文
繁體中文
 Bahasa
Melayu
Bahasa
Melayu
 Tiếng
Việt
Tiếng
Việt
 ไทย
ไทย
 日本語
日本語
 한국어
한국어
 ភាសាខ្មែរ
 español