


0
US Dollar Index
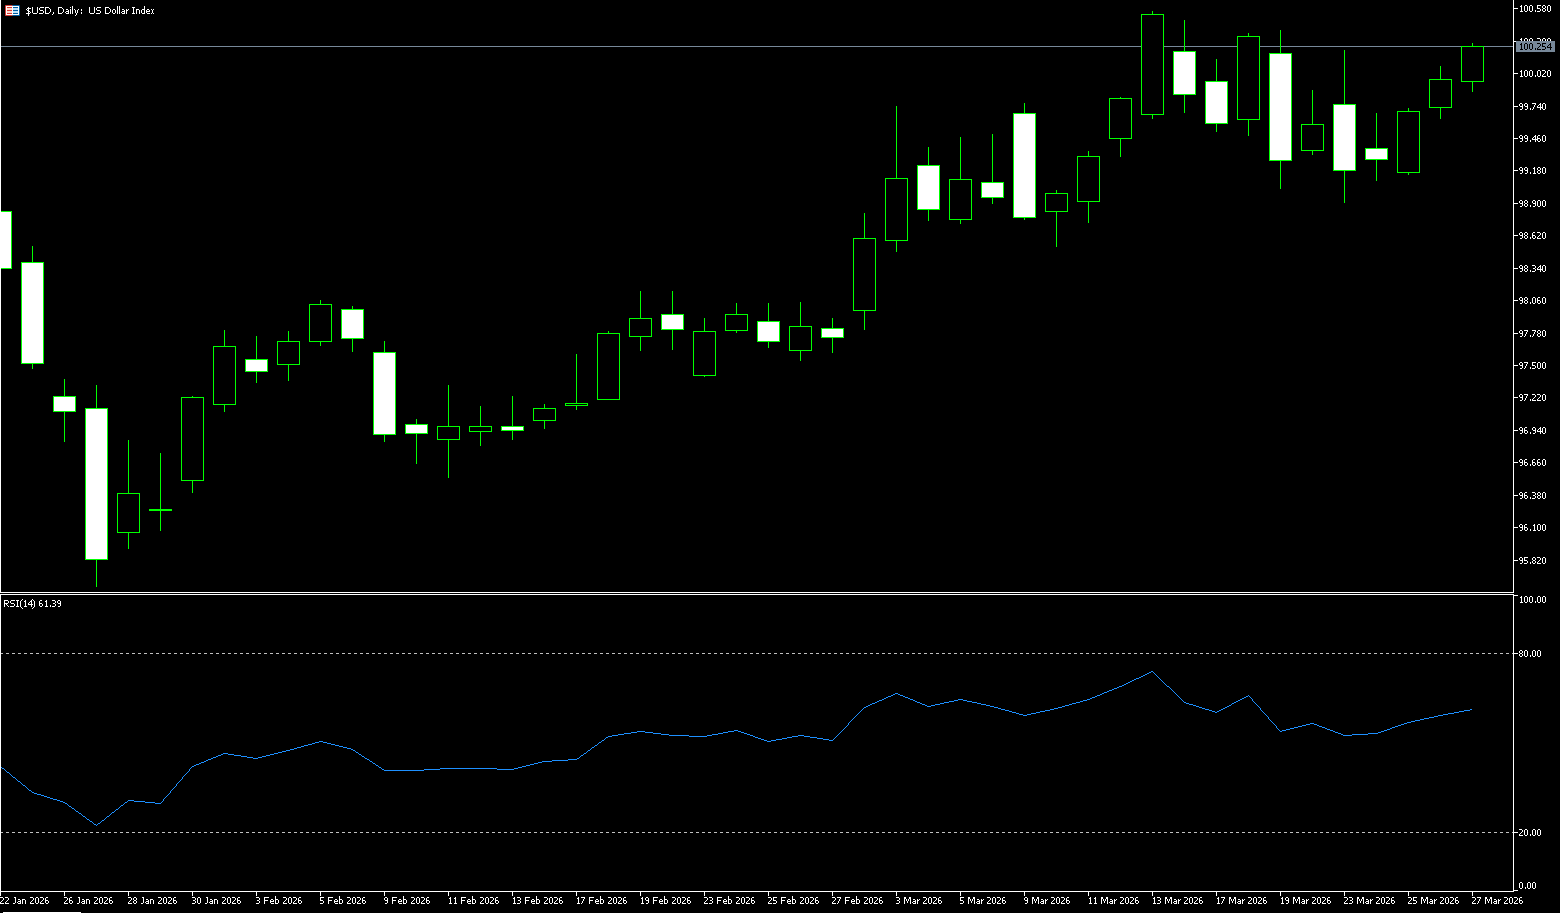
The US dollar index remained stable around 100 before the end of last week, expected to rise by about 0.69%, as continued concerns about a war with Iran, rising oil prices, and their impact on inflation and economic growth continued to support the currency. Oil prices are near 2022 highs, and the market expects the conflict to continue into April as attacks in the Middle East continue. This comes against the backdrop of US President Trump announcing a 10-day pause in attacks on Iranian energy infrastructure until April 6 to allow more time for negotiations. However, some investors are concerned that this window could also be used by the US to deploy additional troops to the region. Meanwhile, traders have lowered their expectations for a Fed rate cut this year, although the central bank still expects a 25 basis point cut in 2026. The dollar strengthened mainly against the pound and the Swiss franc, but was little changed against the euro, the yen, and the Australian dollar. On the other hand, rising real yields in Europe are increasingly offsetting the traditional support for the dollar from rising US real yields. The narrowing real interest rate differential between the US and Europe limits further upside for the dollar. The US dollar currently lacks strong reasons for a rebound, both in terms of nominal and real interest rates. The market consistently favors higher real dollar interest rates, but similar rates in Europe have risen more sharply, which will act as a buffer against further dollar strength, especially given peak safe-haven demand. Furthermore, due to safe-haven interest, dollar hedging demand may have decreased, and the market does not expect a return to pre-conflict conditions. Nevertheless, the dollar currently lacks a broader reason for a rebound based on either nominal or real interest rates.
The US dollar index exhibited a high-level consolidation pattern last week, with weakening bullish momentum. The core trading range was 98.88 (last week's low) – 100.54 (this year's high), indicating intensified short-term bullish and bearish competition. The current trend of the US dollar index hinges on the interplay between inflation expectations and policy paths. Rising energy prices reinforce high interest rate expectations, providing medium-term support for the dollar, but geopolitical uncertainties and divergent economic data have led to short-term volatility. Technically, the index remains oscillating with a slightly bullish bias, but has failed to break through key resistance levels, indicating insufficient upward momentum. In the short term, we need to focus on the breakthrough of 100.54 (this year's high) and the performance of US economic data. Before a clear direction emerges, the main theme will remain oscillation. The latest price is around 100, which is above the 5-day and 10-day moving averages. The short-term moving averages have formed a slight death cross, and the trend is showing a bearish signal. In terms of technical indicators, the MACD is as follows: the two lines are converging below the zero axis, the green bars are increasing slightly, and the bearish momentum continues mildly. The RSI (14) is at 61.27, which is in the neutral-to-positive zone. It is not overbought but lacks upward momentum. On the other hand, the Bollinger Bands are narrowing, and the index is oscillating near the middle band. The volatility is weakening, and we are waiting for a direction to be chosen. The US dollar index is currently running near the short-term moving averages. The 100 level constitutes an important resistance above. This position is also a psychological level. Last week, the psychological level was tested again. A break below this level would target 100.54 (the high of March 13th) and the 101 psychological level. On the downside, the 99.63 level (the 9-day moving average) is a key support zone; a break below this level could trigger a further pullback to the 99.00 psychological level and the 98.88 level (last week's low).
Today, consider shorting the US Dollar Index at 100.30, with a stop-loss at 100.40 and targets at 99.80 and 99.70.
WTI Crude Oil
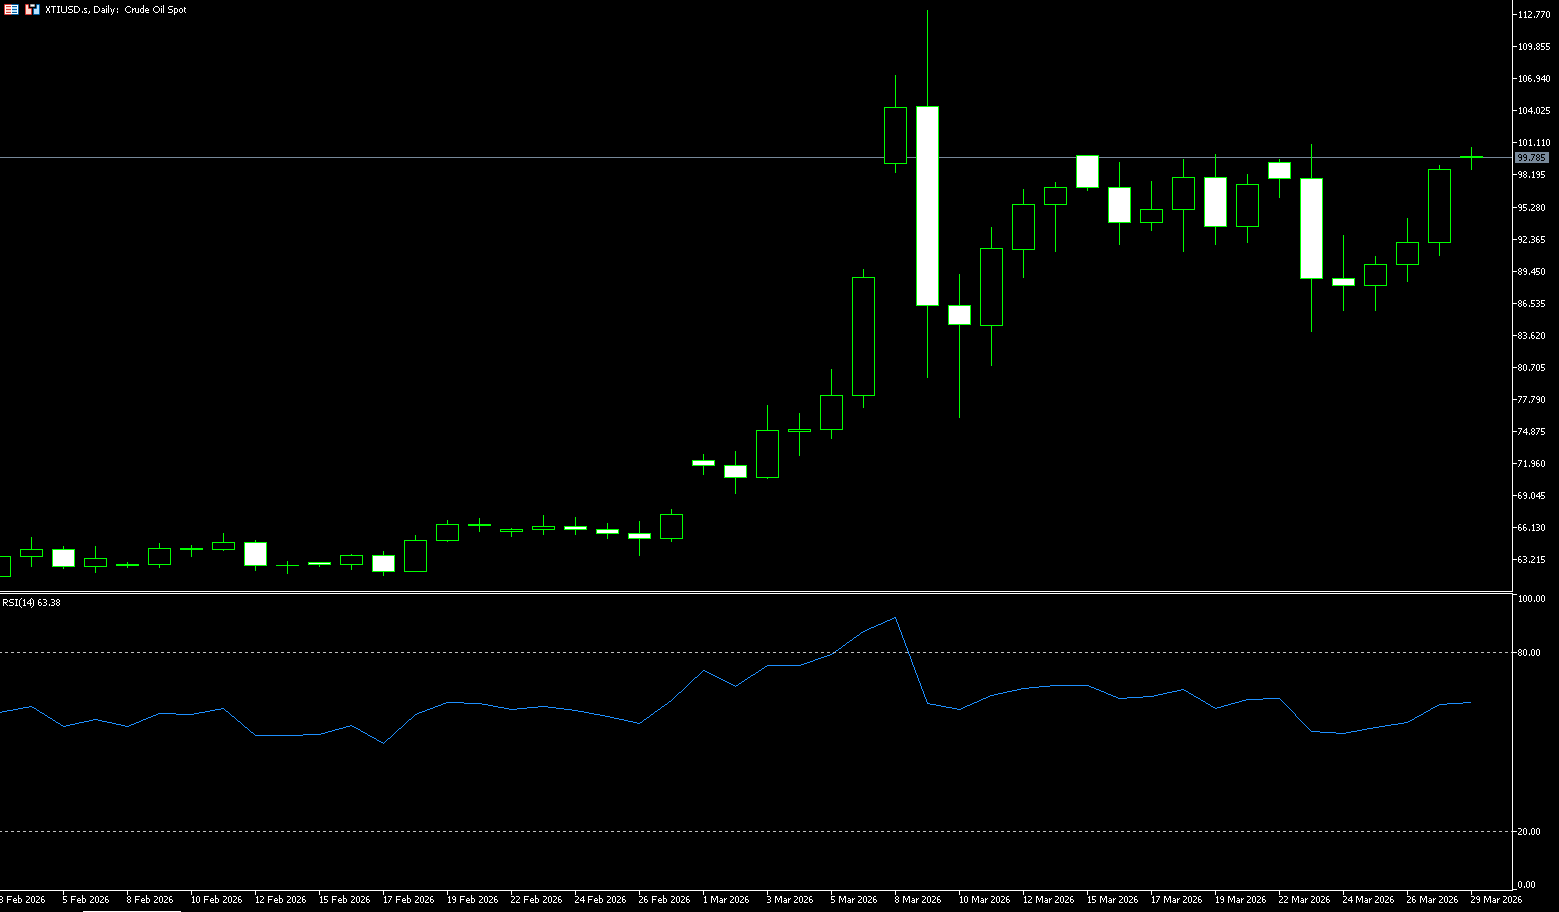
WTI crude oil prices fluctuated around $95.00 last week after conflicting statements from the US and Iran regarding efforts to end the conflict caused turmoil in global energy markets. Iran stated it had no intention of negotiating with the US and would reject a proposed ceasefire, instead proposing conditions including sovereignty control over the Strait of Hormuz. Meanwhile, the White House insisted peace efforts were ongoing, sending a 15-point proposal to Iran through Pakistan aimed at resolving the conflict and reopening this crucial waterway. The near closure of the Strait of Hormuz has severely disrupted global oil flows, resulting in millions of barrels of lost supply daily. Although some vessels continue to pass under Iranian protection, US allies in the Asia-Pacific region, including South Korea, Australia, and the Philippines, are facing increasing fuel shortages. Meanwhile, as markets reassessed the risks of the Iranian conflict and shifted focus to potential diplomatic solutions, WTI and Brent crude oil prices remained below $100. The report attributes the easing of peak oil price panic to domestic political pressure in the US and Tehran's tentative steps to ease restrictions in the Strait of Hormuz, impacting both WTI and WTI oil prices and the broader risk environment for the early summer outlook.
WTI crude oil traded in a high-level consolidation pattern last week, with geopolitics dominating short-term fluctuations. Technical indicators show weakening upward momentum and increasing downward pressure, with the core range remaining within an ascending triangle on the daily chart. At the beginning of last week, influenced by rising expectations of US-Iran negotiations, oil prices quickly fell from above $100 to around $84, releasing the previous geopolitical premium. Due to Iran's denial of direct negotiations, the ongoing Middle East conflict, and a larger-than-expected increase in EIA inventories, oil prices fluctuated wildly between the $88.64 (Polaris midline) and $100 (psychological level). Currently, WTI oil prices are consolidating at high levels, having entered a phase of profit-taking and news-driven speculation after the previous surge, forming a wide trading range of $88-$100. The 5-day and 10-day moving averages of the moving average system have turned downwards, while the 20-day moving average (approximately $88.64) provides strong short-term support. Prices have been fluctuating above the moving averages, and the medium-term bullish trend has not been completely broken. The RSI (14) indicator has fallen from the overbought zone to 66.74, indicating increased bullish momentum and a need for correction. The MACD has formed a death cross at a high level, with the green bars expanding, indicating downward pressure; however, it has not fallen below the zero axis, suggesting continued resistance from the medium-term bulls. In recent weeks, geopolitical news has been abundant, causing significant oil price volatility, and the technical picture is easily influenced by sudden news. If the US-Iran negotiations make progress before the end of this month, oil prices are likely to break below $80, testing the $79.69 (30-day moving average) – $80.00 (psychological level) support. If negotiations fail to make substantial progress, the situation deteriorates, and the conflict escalates again, oil prices are expected to return above $100, challenging the $113.28 (previous high) level. Today, consider going long on spot crude oil at 98.80, with a stop-loss at 98.60 and targets at 101.00 and 102.00.
Today, consider going long on spot crude oil at 98.80, with a stop loss at 98.60. Target: 101.00; 102.00
Spot Gold
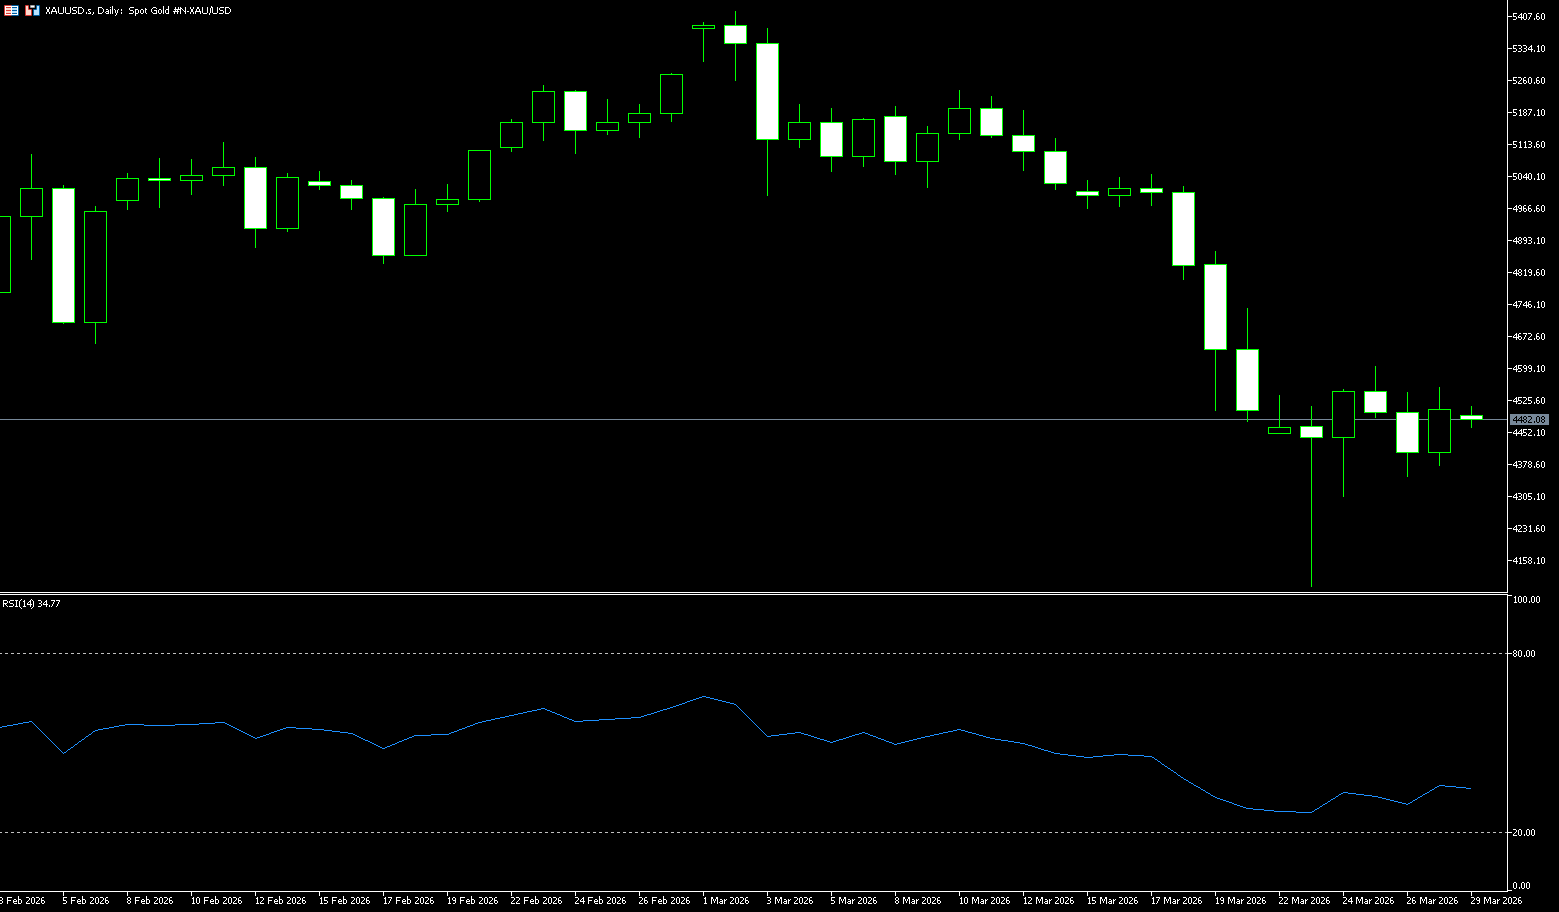
Latest market data shows that spot gold prices are currently hovering around $4,500-$4,480 per ounce, a cumulative decline of over 20% from the historical peak of approximately $5,598 per ounce reached on January 29. This pullback was mainly driven by a stronger US dollar index, a recovery in global risk appetite, and some profit-taking. However, geopolitical risks related to the Middle East conflict have not completely subsided, and supply disruptions and uncertainties continue to provide structural support for gold. This confirms the market's view that short-term volatility should not be overly pessimistic, emphasizing that historical experience shows that similar geopolitically driven pullbacks often present buying opportunities. From a fundamental perspective, gold, as a traditional safe-haven asset, typically rises rapidly in the early stages of a conflict, but once the market digests the initial shock, coupled with other macroeconomic factors such as a strong US dollar, a phased pullback occurs. However, as the conflict persists, safe-haven demand, central bank gold purchases, and investors' diversified allocation logic will gradually strengthen the bullish reasons. The current global central bank gold-buying trend remains unchanged, and coupled with the long-term existence of geopolitical uncertainties, the upward trend of gold's central value has not been broken. Long-term expectations remain above $4,500/ounce, demonstrating strong confidence in a structural bull market.
However, rising geopolitical risks and inflation expectations have led to a synchronized rise in the US dollar index and US Treasury yields, creating a double whammy for gold prices. On the one hand, a stronger dollar significantly reduces the attractiveness of dollar-denominated gold to non-dollar holders; on the other hand, rising US Treasury yields further highlight the disadvantage of gold holdings without interest income, accelerating capital outflows from the precious metals market. Looking at the daily chart for gold, prices attempted to stabilize above the 100-day simple moving average near $4,627.50, but the 9-day simple moving average (4580.80) has fallen below the 100-day simple moving average (4627.50), forming a bearish "death cross" pattern, signaling increased short-term selling pressure. On the indicators front, the Relative Strength Index (RSI) is hovering around 35, nearing oversold territory, but the current bearish momentum remains strong. The Average Directional Index (ADX) is still rising, indicating that the bearish momentum has not been exhausted and a rapid reversal is unlikely in the short term. If gold prices break below Thursday's low of $4,502 and the $4,500 level, the next support level will test the April 2nd low of $4,402. Further downside targets the 160-day simple moving average ($4,276), a key medium- to long-term support level. If gold prices can rise above the 100-day simple moving average at $4.62740, a technical rebound is possible, with the first resistance level at the 65-day simple moving average ($4,847.60). A break above this level would challenge the psychological level of $5,000. If $5,000 is firmly established, the second short-term resistance level is $5,200, a key point for determining whether gold prices have reversed.
Today, consider going long on spot gold at 4,490, with a stop loss at 4,485 and a target of 4,530. 4,550
AUD/USD
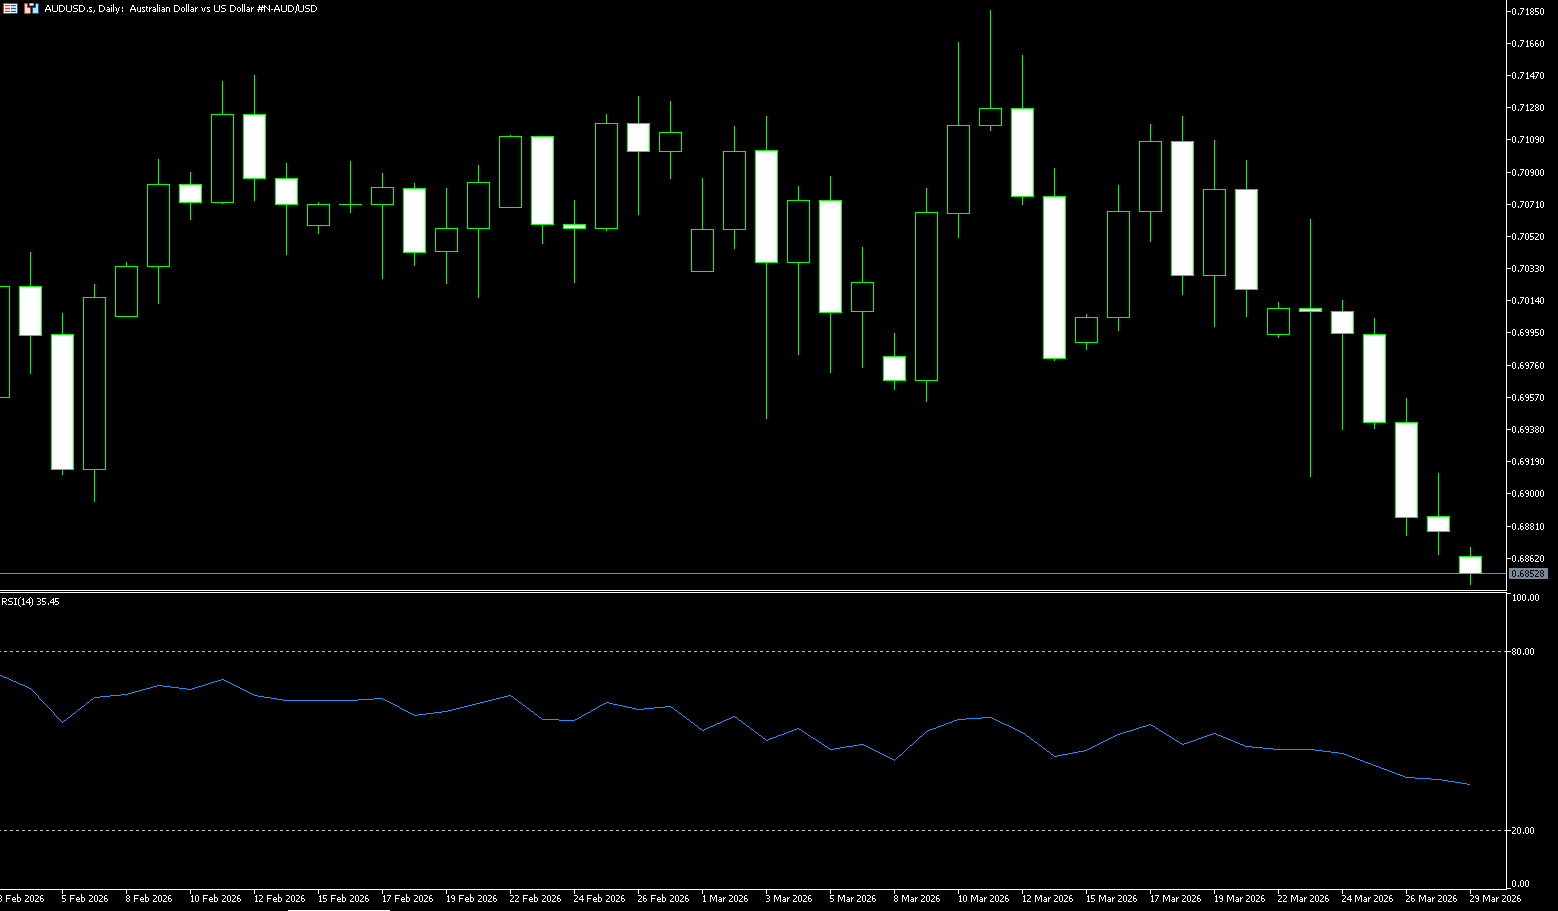
The Australian dollar fell for several consecutive trading days last week, breaking through the psychological level of 0.70. The pair also hit a two-month low of 0.6864, influenced by the weakening Australian dollar as rising oil prices weighed on market sentiment amid uncertainty surrounding US-Iran peace talks. Earlier last week, US President Trump stated that Washington would suspend attacks on Iran's energy sector for 10 days, extending the previous April 6 deadline to allow room for negotiations. Trump hinted that this decision was at Iran's request. However, the Wall Street Journal reported that mediators said Iran denied making such a request, highlighting the fragility of the diplomatic process and the low likelihood of a near-term ceasefire. Meanwhile, the Pentagon is considering plans to deploy up to 10,000 additional ground troops to the Middle East. Defense officials noted that this option aims to enhance strategic flexibility to escalate rapidly should negotiations break down, while maintaining a credible deterrent in the region. Regarding monetary policy, Reserve Bank of Australia Assistant Governor Christopher Kent warned on Thursday that policymakers may need to take action to curb inflation as energy prices rise. Kent added that the board remains focused on achieving low and stable inflation and full employment, which could push up short-term neutral interest rates and require tighter policy. Meanwhile, Federal Reserve Governor Stephen Milan stated that reducing the size of the Fed's balance sheet would support a more effective interest rate policy.
The Australian dollar against the US dollar showed a clear downward trend last week, dominated by bears, with limited upside potential in the short term. The risk of a break below key support levels should be noted. On the daily chart, AUD/USD is trading below 0.6900. The short-term bias is bearish, as the pair broke below the rising support line that guided it from the 0.68 area and is currently trading below the recent series of support closes at 0.70–0.71. The 5/10/20-day moving averages are in a bearish alignment, forming a death cross and trading below all short-term moving averages, confirming the downtrend. These moving averages now act as upward resistance, confirming a loss of upward momentum. The 14-day Relative Strength Index (RSI) has fallen to around 37.66, indicating increased downward pressure rather than just a brief pause in the previous uptrend. The MACD continues to diverge below the zero line, indicating increasing bearish momentum, with no golden cross signal. Initial resistance is located in the 0.7000 area, a psychological level where the broken uptrend line intersects with converging moving averages. A break above this area would alleviate immediate selling pressure and open up space towards 0.7054 (the 34-day moving average). A break below this level would target 0.7100 (the psychological level) and 0.7187 (this year's high). Immediate support is located at the 100-day moving average at 0.6815 and near the 0.6800 (psychological level). Continued weakness could lead to a further decline towards 0.6753 (the low of January 22).
Today, consider going long on the Australian dollar at 0.6860, with a stop loss at 0.6850 and targets at 0.6930 and 0.6940.
GBP/USD
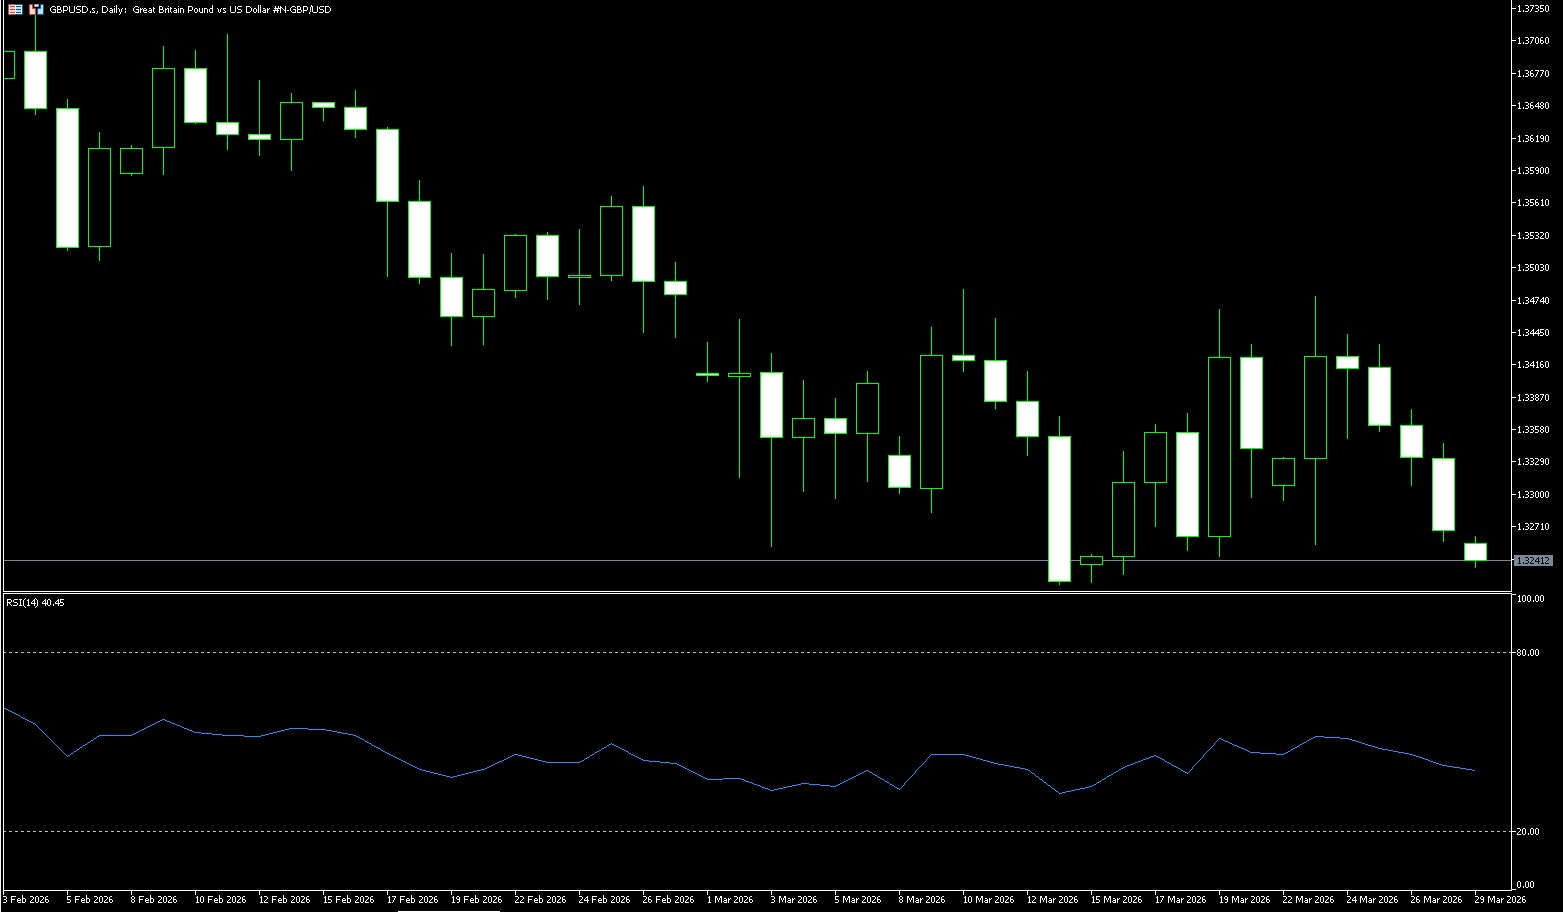
GBP/USD rose in late last week, approaching 1.3470, supported by improved risk appetite that capped a dollar rebound. The pound maintained its weekly gains, driven by the Bank of England's unexpectedly hawkish shift. The Bank of England's unanimous decision to keep interest rates unchanged last week and the sharp repricing of short-term rates pushed UK yields significantly higher, supporting the pound. However, before the weekend, the pound weakened against the dollar, continuing its decline below the 1.3300 support level. The market environment of reduced risk appetite continued to support the dollar and suppress the pound and its peers, as investors grew increasingly concerned about the potential economic impact of the ongoing conflict in the Middle East. A deteriorating situation in the Middle East and rising energy prices could impact equities, reversing some of the tightening and weakening yield support for the pound. Continued deterioration in the Middle East and further increases in energy prices could alter the resilience of equities, and a sharp decline in equities could reverse some of the tightening. The pound is currently receiving support from soaring yields (although the support is weaker compared to such a large interest rate change), and this support could disappear if broader risk conditions worsen. Meanwhile, the repricing of interest rate expectations by the European Central Bank and the Bank of England kept the euro/pound relatively stable, with all volatility occurring primarily in the pound/dollar pair. Oil prices have now regained their dominance, but the Bank of England's hawkish stance provided additional support for the pound.
Last week, the pound/dollar pair experienced a pattern of rising and then falling back, trending weaker with a weekly range of approximately 260 points, ultimately closing near 1.3260, forming a long upper shadow bearish candlestick on the weekly chart. Expectations of a brief easing of tensions in the Middle East pushed the dollar weaker at the beginning of the week, causing the pound/dollar pair to rebound from around 1.3330, reaching a weekly high of 1.3478, approaching a key resistance zone. Subsequently, Iran's denial of negotiations and a reversal of geopolitical conflict expectations led to a return of safe-haven funds to the dollar; coupled with weaker-than-expected UK retail sales data, the exchange rate quickly fell back, testing the 1.3250 area. The MACD indicator showed a long upper shadow bearish candlestick, with the price center shifting downwards below the zero line, indicating that the bears are in control but momentum is weakening. The RSI (14) is in a weak zone but not oversold, and the KDJ is turning upwards, indicating a short-term need for a bottoming out and recovery. It is expected that this week will continue the wide-range fluctuations between 1.3095 (the low of November 25th last year) and 1.3100 (the psychological level) to 1.3431 (the 200-day moving average) and 1.3435 (the high of last Wednesday), with the direction depending on the geopolitical situation and the performance of UK and US data. If the Middle East situation eases this week and US data weakens, the exchange rate will break through 1.3300 (the psychological level) and then look towards the 1.3431-1.3435 area. Conversely, if the Middle East geopolitical conflict escalates and US data is strong, the GBP/USD exchange rate will fall below 1.3200 and continue to test the vicinity of 1.3095 (the low of November 25th last year) and 1.3100 (the psychological level).
Today, consider going long on GBP at 1.3250, with a stop-loss at 1.3235 and targets at 1.3300 and 1.3320.
USD/JPY
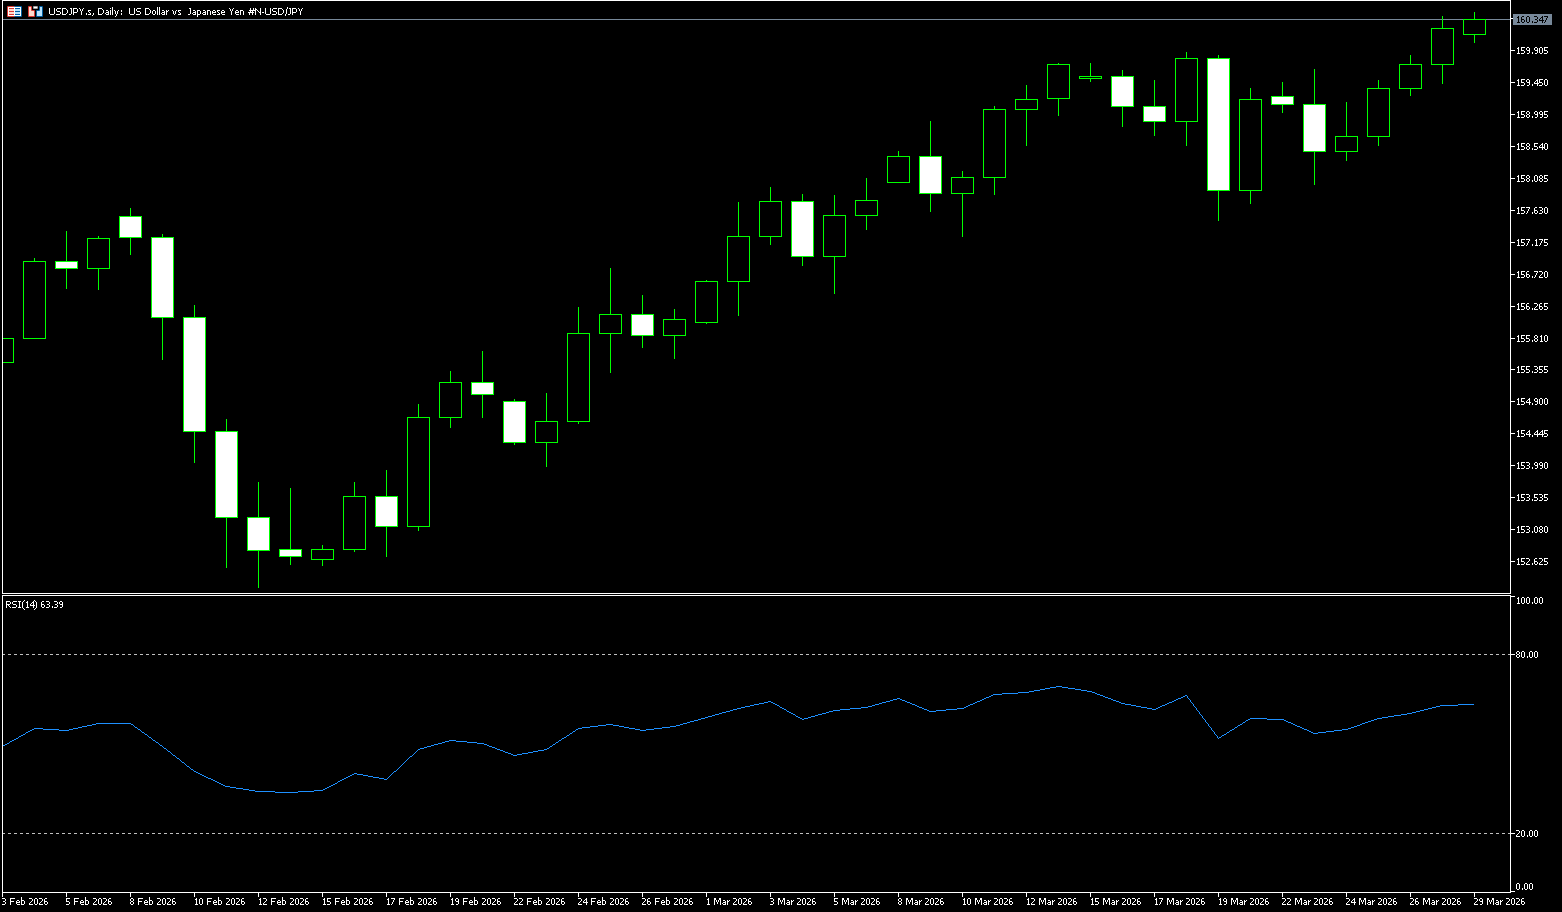
Before the weekend, USD/JPY finally broke through the Bank of Japan's psychological barrier of 160, reaching a high of 160.41, the highest level since August 2024. Earlier, the USD/JPY pair experienced a large-scale sell-off, falling to around 157.50. The Bank of Japan's decision to maintain interest rates was met with muted reaction, and the yen strengthened after Governor Kazuo Ueda's remarks at the post-meeting press conference. In fact, Ueda expressed concern about the pace of inflation, predicting upward pressure on inflation due to rising oil prices caused by tensions in the Middle East. However, Ueda stated that underlying inflation is expected to reach a level consistent with the price target in the latter half of the forecast period, adding that real interest rates are at a significantly low level. Ueda reiterated that if economic and price trends meet expectations, the central bank will continue to raise policy rates to match improvements in the economy and prices. This statement, coupled with market speculation that Japanese authorities would intervene to curb further weakening of the yen, boosted the yen and suppressed the USD/JPY currency pair. On the other hand, the dollar extended its gains from Wednesday, driven by strong Producer Price Index (PPI) data and a hawkish outlook from the Federal Reserve. Meanwhile, investors remained concerned that war-driven oil price spikes could weaken Japanese economic growth and reignite inflation, creating a typical stagflation environment and increasing the difficulty of the Bank of Japan's normalization policy. This could limit aggressive bets on the yen and help limit the decline in USD/JPY.
At the close of last week, the USD/JPY technical chart showed a pattern of "a well-maintained bullish trend on the daily chart, with short-term high-level pressure and consolidation." Overall, it trended upwards and broke through the 160.00 level, a psychological barrier for Bank of Japan intervention, intensifying the battle between bulls and bears. The pair closed with a medium-sized bullish candle at 160.20, a weekly gain of approximately 0.68%, holding above short-term moving averages and continuing its medium-term upward trend. Since the January low of 152.10, the exchange rate has continued to rise, reaching a high of 160.41 before the end of last week, forming a clear upward channel, and the bullish dominance remains unchanged. The exchange rate is running above all key moving averages (MA10/20/50), and the moving averages are arranged in a bullish pattern, providing strong support. The MACD indicator is above the zero axis, the red bars are converging but still positive, the bullish momentum is weakening but the trend is not broken. As for the RSI (14), it is at 62.22, in the strong range but not overbought, and there is still room for upward movement. In addition, the currency pair is running close to the upper Bollinger Band, the opening is narrowing, the short-term volatility is decreasing, and the high-level consolidation characteristics are obvious. Therefore, the core short-term trading range is 159.00-161.05 {key resistance at the weekly level}, and a breakout of this range will indicate the short-term direction. The 158.65 (20-day moving average) and 158.78 (March 25th low) levels below represent important recent support zones. A break below these levels could trigger a correction towards 157.50 (March 19th low) and 157.47 (30-day moving average). Currently, the price is trading above all key moving averages, indicating bullish dominance. However, strong historical resistance exists around the 160.00 (psychological level) to 160.41 (last week's high) area, which is also a sensitive zone for potential policy intervention, forming key resistance. A break below this level would target 161.05 (key weekly resistance), and a successful break above this level would confirm a new upward trend.
Today, consider shorting the US dollar at 160.40, with a stop loss at 160.60 and targets at 158.80 and 158.50.
EUR/USD
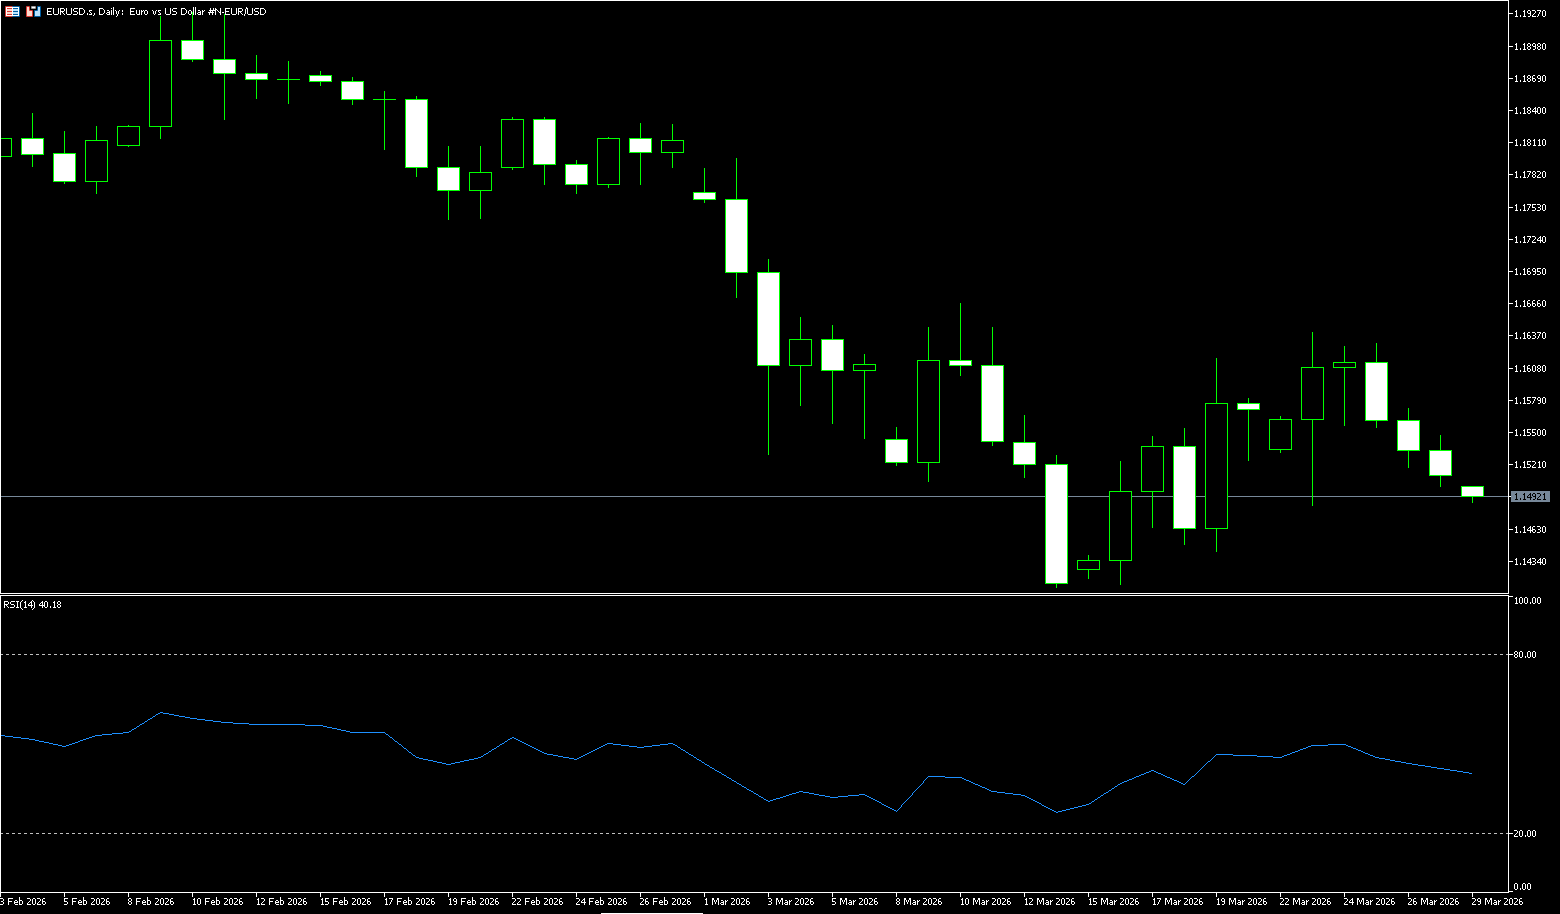
Last week, the euro fell to 1.1500 before the dollar, as traders weighed the latest developments in US-Iran negotiations, including President Donald Trump extending the deadline for a deal by 10 days to April 6. Despite German Foreign Minister Johann Wadpur confirming indirect contacts and upcoming direct talks in Pakistan, the market reaction was muted, indicating skepticism about an imminent breakthrough, with President Trump seen as buying time to strengthen the military presence in the region. Meanwhile, Spain's inflation rate surged to 3.3% in March, the highest level since June 2024, although below the expected 3.9%. The shift in ECB policy expectations is significant: traders now expect at least two rate hikes this year, with a strong possibility of a third, reversing previous bets on a 40% chance of a rate cut in 2026. Meanwhile, concerns about slowing European economic growth outweighed expectations of interest rate hikes due to geopolitical disruptions to supply chains. Although the European Central Bank may face further policy tightening to combat inflationary pressures, the market is more worried about the combined effects of a high-interest-rate environment and the energy crisis leading to a recession. European currencies are currently under the shadow of stagflation expectations. Market speculation has shifted across the board; although the final interest rate may rise, the relative attractiveness of the euro against the dollar is weakening, and the logic of capital flowing back to North America remains unchanged.
The euro/dollar pair showed a weak and volatile technical pattern last week, primarily fluctuating within the 1.1490–1.1600 range. Short-term bears had the upper hand, but downward momentum slowed. After a sharp sell-off from above 1.2000 to below 1.1500, the euro/dollar pair has exhibited an almost eerily calm and volatile trend over the past two weeks. Currently, the pair is showing a clear tug-of-war between bulls and bears, with the ongoing repercussions of the Middle East conflict remaining a significant external factor influencing the euro's trajectory. The euro/dollar pair closed last week at around 1.1510, far from the high of 1.1640. In terms of moving averages, the exchange rate is below the 50-day and 100-day moving averages, with the 25-day moving average (1.1614) providing direct resistance, indicating an overall bearish trend. A short-term rebound requires a firm hold above 1.1568 (the 20-day moving average) and 1.1572 (last Thursday's high); otherwise, the upside potential is limited. The 14-day RSI is at 40.58, below the 50 neutral line, indicating bearish dominance but not oversold conditions, suggesting further downside potential. The ADX is above 34, indicating a clear downtrend, not simple sideways movement. Over the past two weeks, the euro/dollar pair has formed higher lows and higher highs near its previous lows, exhibiting a mild bottoming pattern. While this trend remains weak on the long-term chart, most trend reversals often begin with similar slow bottoming processes, similar to the euro/dollar pair's initial higher lows in early February, which were subsequently broken by the bears. On the upside, the current 1.1600 level remains a crucial dividing line between bullish momentum and weakness. A decisive break above this level would open up potential targets at 1.1678 (the 200-day moving average) and 1.1700 (the psychological level). On the downside, the psychological level of 1.1500 and the low of last week (1.1485) have provided effective support, while the area around 1.1411 (the low of March 13th) and the psychological level of 1.1400 forms short-term support.
Today, consider going long on the Euro at 1.1500, with a stop-loss at 1.1486 and targets at 1.1550 and 1.1570.
Disclaimer: The information contained herein (1) is proprietary to BCR and/or its content providers; (2) may not be copied or distributed; (3) is not warranted to be accurate, complete or timely; and, (4) does not constitute advice or a recommendation by BCR or its content providers in respect of the investment in financial instruments. Neither BCR or its content providers are responsible for any damages or losses arising from any use of this information. Past performance is no guarantee of future results.
More Coverage


Risk Disclosure:Derivatives are traded over-the-counter on margin, which means they carry a high level of risk and there is a possibility you could lose all of your investment. These products are not suitable for all investors. Please ensure you fully understand the risks and carefully consider your financial situation and trading experience before trading. Seek independent financial advice if necessary before opening an account with BCR.
BCR Co Pty Ltd (Company No. 1975046) is a company incorporated under the laws of the British Virgin Islands, with its registered office at Trident Chambers, Wickham’s Cay 1, Road Town, Tortola, British Virgin Islands, and is licensed and regulated by the British Virgin Islands Financial Services Commission under License No. SIBA/L/19/1122.
Open Bridge Limited (Company No. 16701394) is a company incorporated under the Companies Act 2006 and registered in England and Wales, with its registered address at Kemp House, 160 City Road, London, City Road, London, England, EC1V 2NX. This entity acts solely as a payment processor and does not provide any trading or investment services.

 English
 简体中文
简体中文
 繁體中文
繁體中文
 Bahasa
Melayu
Bahasa
Melayu
 Tiếng
Việt
Tiếng
Việt
 ไทย
ไทย
 日本語
日本語
 한국어
한국어
 ភាសាខ្មែរ
 español