


0
Currency & Commodity Analysis:
US Dollar Index
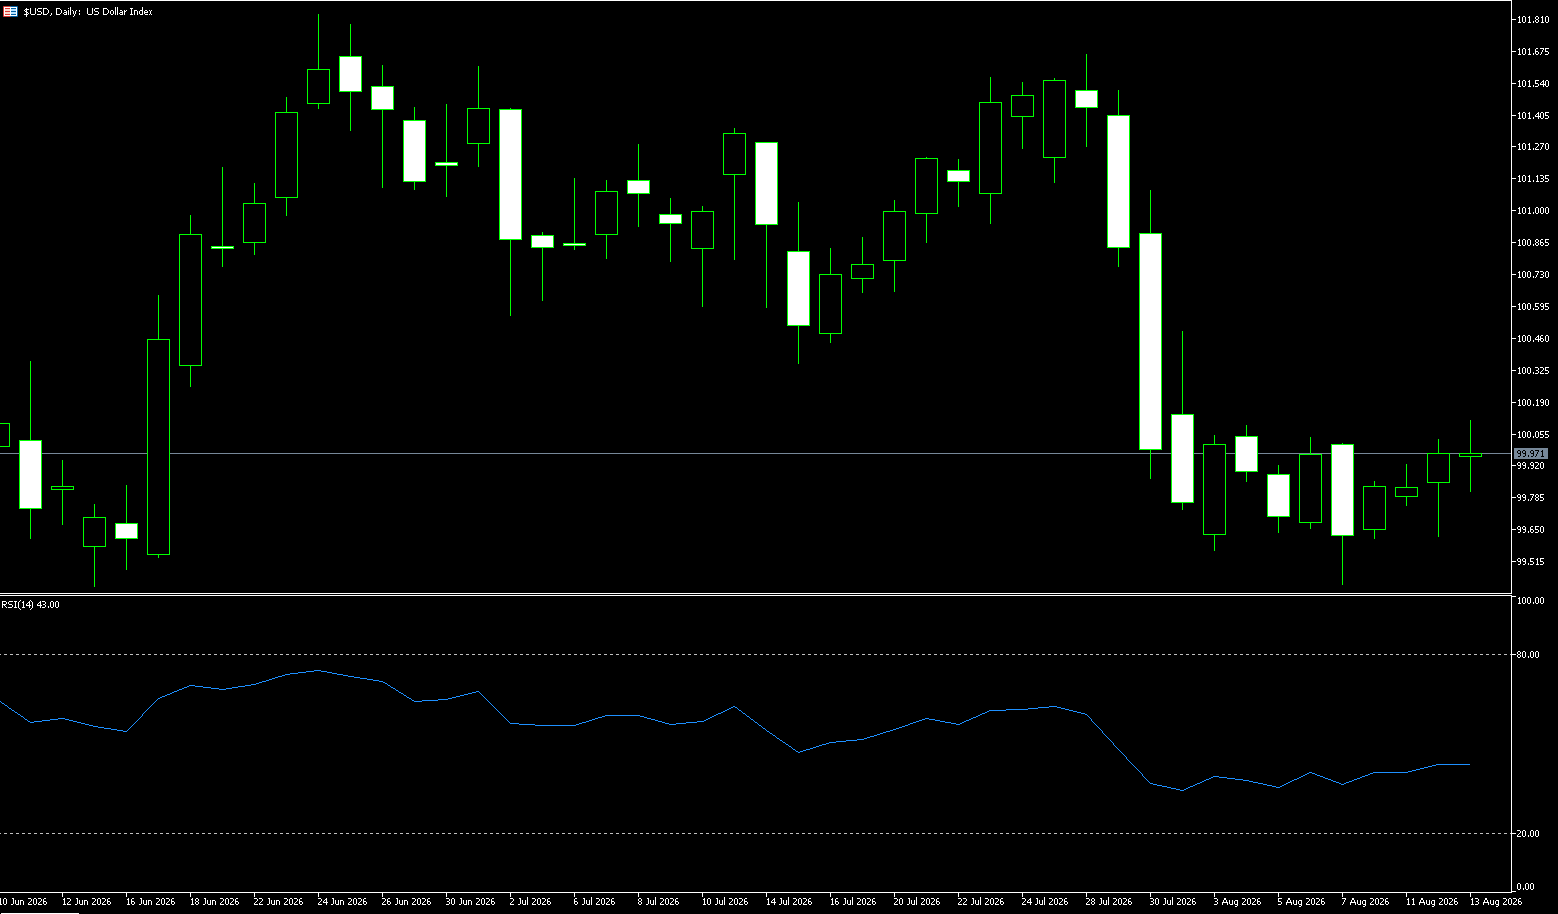
The US dollar index rose slightly to around 99.90 on Thursday. Although the US July CPI data released that day met expectations, traders further postponed their bets on the timing of the Fed's rate hike. Data showed that the US July CPI rose 3.4% year-on-year, and the core CPI rose 2.5% year-on-year, both moderately lower than the previous values. Affected by the unexpectedly weak July jobs report last Friday, market expectations for a Fed rate hike in September continued to cool—federal funds rate futures showed that the probability of a September rate hike had fallen from 55% a week ago to 40%. The dollar was expected to continue weakening amid weak employment and moderate CPI data, but it unexpectedly held firm, partly due to rising oil prices and escalating geopolitical risks related to the Strait of Hormuz. Among major currencies, the euro fell 0.14% against the dollar to 1.1524, while the dollar rose slightly by 0.1% against the yen to 159.40. The yen has given back some of its gains following the joint US-Japan intervention, and MUFG analysts noted signs of renewed speculative short positions.
The dollar index is currently trading around 99.80-90; it has broken below the 20-day (100.45) and 50-day (100.51) short-to-medium-term moving averages, finding only weak support near the 100-day moving average (99.75). Looking at the moving average system, the short-term moving averages have turned downwards and formed a death cross with the medium-term moving averages, while the 200-day moving average (99.17) continues to provide long-term support, presenting an overall tug-of-war between short-term bearish and long-term bullish sentiment. The MACD indicator has issued a clear bearish signal, indicating that downward momentum is still strengthening, and there are no signs of bullish divergence or convergence yet. The RSI indicator is currently at 43.23, in the weak zone below the 50 midline, but still has room to move before reaching the 30 oversold level, meaning that the bears still have room to exert further pressure, and it hasn't reached the extreme oversold trigger point for a rebound. The 99.41 level (the low of August 7th) is a crucial defense line that the bulls must hold. A decisive break below this level would open up downside potential towards the 200-day moving average (99.17) and even deeper. Conversely, if it can stabilize above 100 and recover the 20-day moving average (100.45), a short-term recovery is possible, but the upside potential is limited before breaking through the 100.50-100.60 resistance zone, and the trend remains predominantly bearish.
Today, consider shorting the US Dollar Index at 100.05, with a stop-loss at 100.15 and targets at 99.70 and 99.60.
WTI Crude Oil
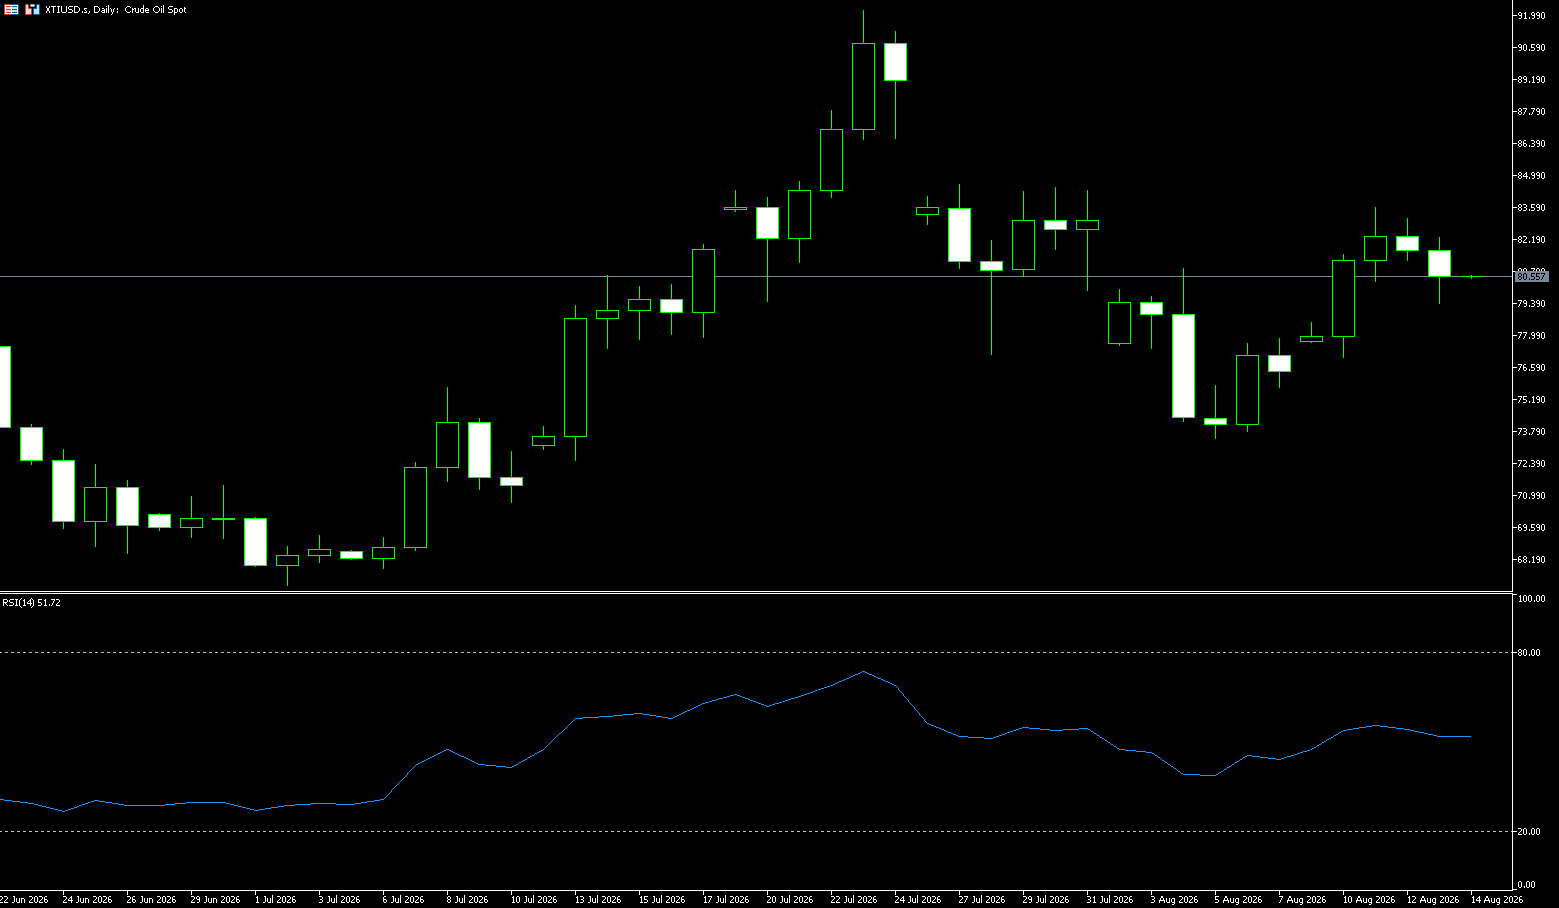
US crude oil fell to slightly below $81.00 per barrel on Thursday, as multiple forecasting agencies lowered their demand forecasts, limiting price gains. Currently, WTI oil is trading around $81.00. The core driver of the oil price bulls is the US missile attack on oil tankers, which has rapidly cooled market expectations for a short-term ceasefire and reconciliation between the US and Iran. Negotiations on the Strait of Hormuz remain stalled. On the bearish side, Pakistan has been mediating between the US and Iran, and its Interior Minister met with Iranian officials in Tehran for talks. Meanwhile, the US has been consistently demonstrating its determination to control oil prices. In the long term, the shortage of high-end US air defense munitions limits large-scale US military operations, while shipping capacity in the Strait of Hormuz and the Strait of Oman disrupts global supply. Multiple geopolitical and macroeconomic variables are jointly influencing the risk premium for crude oil. The current crude oil market is in a game of geopolitical supply contraction and limited US military operations: Insufficient US ammunition reserves have reduced its leverage for military threats, forcing it to resort to economic sanctions and a blockade of Iranian oil shipments. However, this is a double-edged sword. First, it will lead to higher oil prices, contradicting the US's initial intention to open the Strait of Hormuz before the midterm elections to lower prices. Second, it's unknown how long it will take for Iran to compromise; if the blockade is very effective, the US probably won't lift the initial blockade a month ago. In other words, the blockade also puts pressure on the US.
Due to the shortage of high-end US military ammunition, the possibility of a full-scale war is suppressed, limiting the upside potential of oil prices. At the same time, the US is pressuring Ukraine to suspend attacks on Black Sea tankers and stabilize Black Sea oil shipments, while accelerating the construction of alternative pipelines bypassing the Strait of Hormuz in an attempt to hedge against the risks of relying on a single shipping route. Short-term oil price movements will be highly dependent on two variables: whether there is a breakthrough in US-Iran diplomatic negotiations, and whether the global crude oil supply and demand gap is within a safe range, preventing a second supply crisis. Technical Analysis: WTI crude oil experienced a slight rise followed by a pullback, potentially forming a short-term double top pattern on the daily candlestick chart. If this pattern appears, it suggests a price correction is imminent. However, if oil prices do not experience a significant pullback today, the double top pattern will not be confirmed. Furthermore, given the recent sharp rebound in oil prices without a significant pullback, selling pressure is not substantial, and the price is likely to continue rising around the 5-day moving average. Upside targets include $83.98 (75-day moving average) and the $85 (psychological level). Downside targets are $80.00 (psychological level) and $78.66 (9-day moving average).
Consider going long on crude oil today at 8030, with a stop-loss at 80.15 and targets at 83.00 and 82.00.
Spot Gold
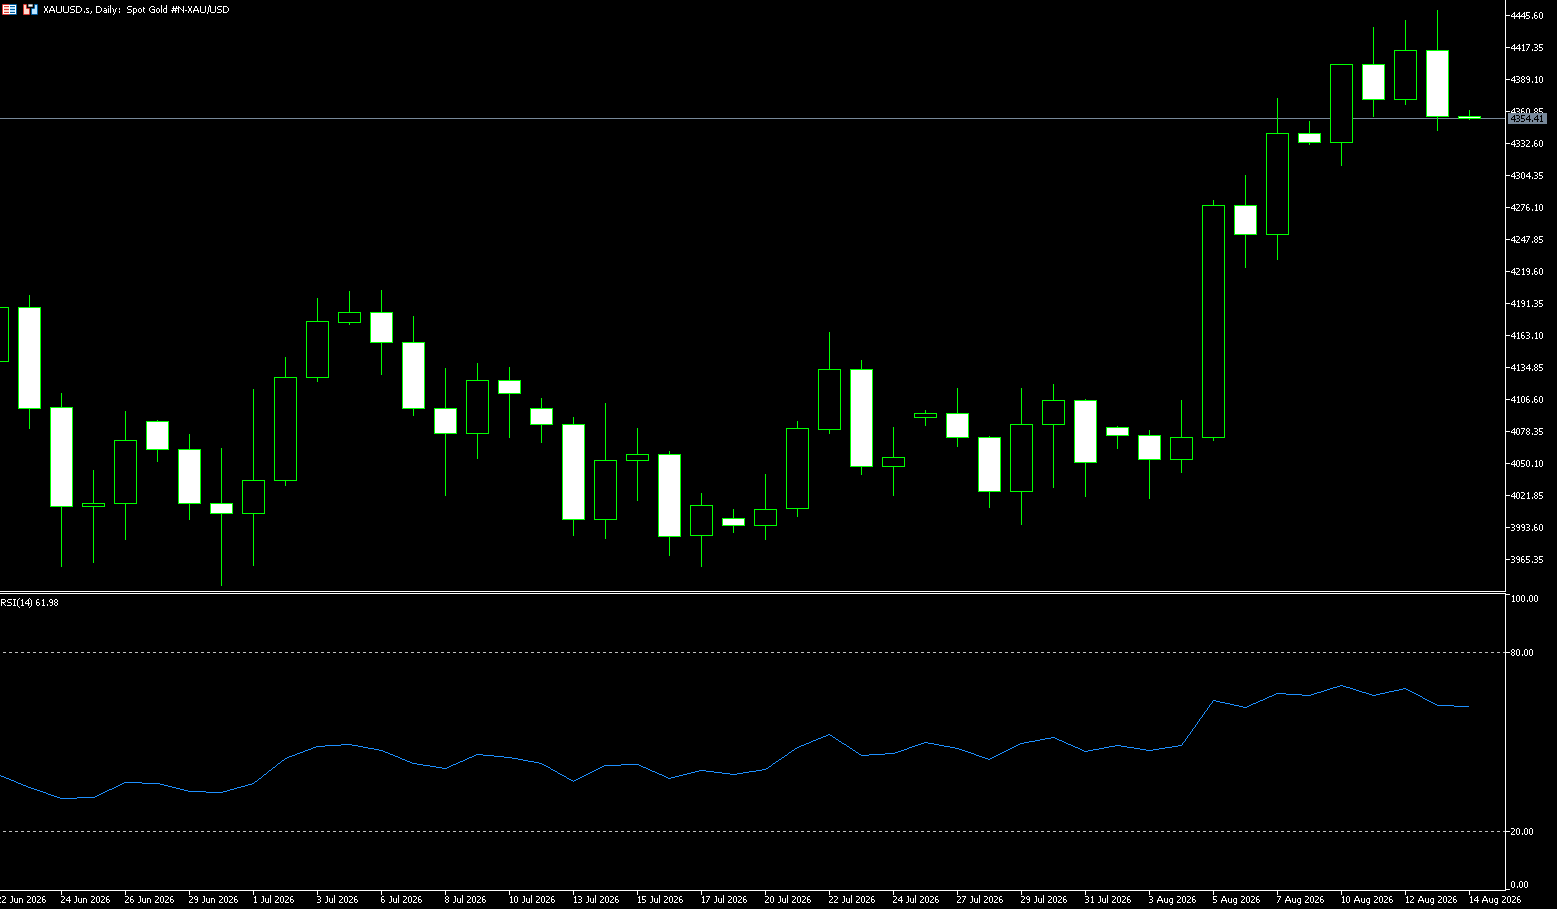
Gold prices fell on Thursday as US economic data showed continued deflation and a moderate slowdown in the job market, while the dollar pared earlier losses. As of press time, gold/dollar was trading at $4,345, down 1%, after hitting an intraday high of $4,450. Data showed that the July CPI rose only slightly by 0.1% month-on-month, fully in line with market expectations, while the year-on-year increase slowed to 3.4% from 3.5% in June. The core CPI, excluding food and energy, rose 2.5% year-on-year, also lower than the previous value of 2.6%. This result temporarily eased previous concerns about a resurgence of inflation. The market reacted quickly. Traders lowered their probability of a Fed rate hike in September from about 46% before the data release to around 40%. The interest rate futures market also adjusted its expectations, with the expected rate hike magnitude falling from nearly 30 basis points to about 26 basis points. Meanwhile, the continued tension in the Middle East did not simply support gold as a traditional safe-haven asset, but instead exerted potential downward pressure on gold prices through the oil price channel.
On Thursday morning, spot gold rose to $4,450, its highest level in nearly two months, but remained capped by the $4,500 psychological level and the $4,503 200-day simple moving average range. This price pattern suggests the market is in a wait-and-see mode, with volatility poised to erupt. On the upside, if gold can sustain its position above $4,400, it will indicate the presence of buying power. A break above $4,4350 (Thursday's high) would negate the closing price reversal top pattern, potentially resuming the uptrend. This could trigger a move towards the long-term Fibonacci level of $4,541.88. Conversely, a break below Wednesday's low of $4,362.60 could trigger a faster decline. It's important to note that below $4300, there's no clear support level until the $4250 to $4230.70 range (the 65-day simple moving average). This means that a break below this level could quickly open up downside potential.
Today, consider going long on gold at $4338, with a stop-loss at $4334; targets: $4380; $4400.
AUD/USD
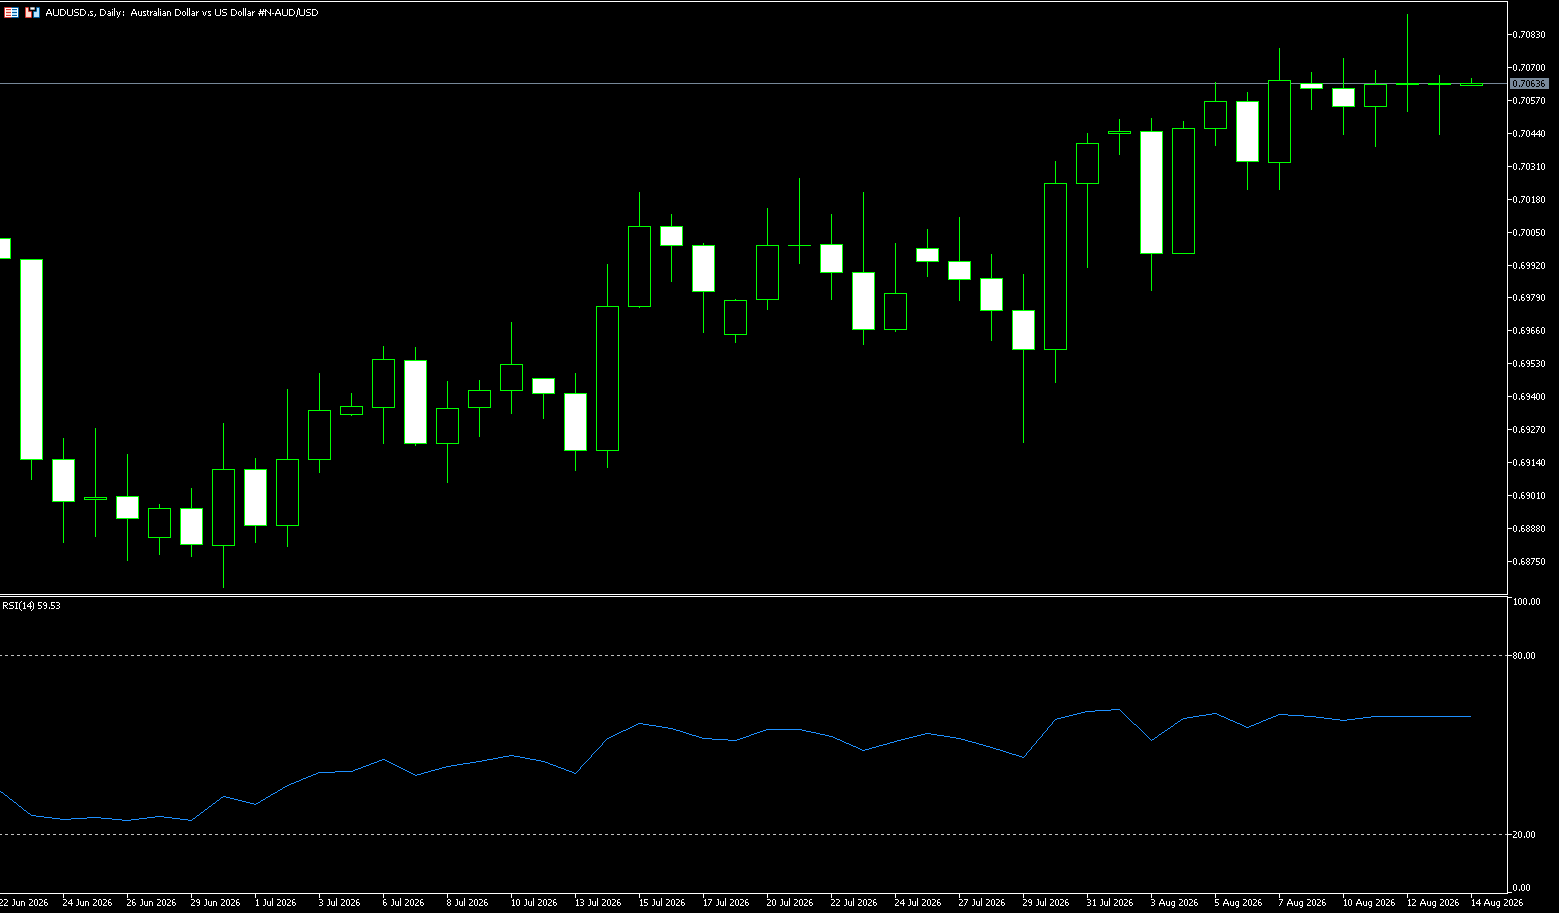
The AUD/USD pair remained stable during Thursday's Asian session, seemingly halting its decline from its June 5 highs. Spot prices remain confined to a familiar range around 0.7050, awaiting a new catalyst for the next directional move. The US dollar struggled to maintain its strong rebound from Wednesday as signs of slowing US inflation dampened market bets on an immediate Fed rate hike. This, coupled with the Reserve Bank of Australia's hawkish outlook, provided a tailwind for the Australian dollar and the AUD/USD pair. Indeed, RBA Governor Michelle Bullock emphasized that upside risks to inflation remain and made it clear that the Board is prepared to raise rates again if price pressures fail to show sufficient downward progress. Investors remain concerned about potential inflation risks due to oil price volatility caused by the US-Iran standoff, despite US President Trump's statement that the US has complete control of the Strait of Hormuz. This leaves geopolitical risks unresolved, providing a tailwind for the safe-haven US dollar and limiting the gains of the AUD/USD pair. Furthermore, the recent range-bound trading around 0.7050 makes it prudent to wait for follow-through buying before continuing the month-and-a-half-long uptrend.
The Reserve Bank of Australia's decision to hold rates steady was in line with expectations, but the next meeting isn't until September 29th. In the meantime, the Federal Reserve will make its decision on September 16th, and with a busy US data schedule, the Australian dollar will almost entirely follow the US dollar's movements. On the daily chart, the AUD/USD is trading around 0.7050, maintaining a short-term bullish bias as the price moves further up within an ascending parallel channel. The pair is currently above the 20-day simple moving average at 0.7016, reinforcing the constructive tone, while Wednesday's high of 0.7091 and the psychological level of 0.7100 provide immediate resistance. The Relative Strength Index (RSI) is at 57, in positive territory but not yet approaching overbought levels, indicating continued buying interest without signs of exhaustion. On the downside, initial support is seen at 0.7016 near the 20-day simple moving average and the 0.7000 psychological level; a deeper support level lies at the 200-day simple moving average at 0.6931 if a corrective pullback occurs.
Consider going long on the Australian dollar today at 0.7046, with a stop-loss at 0.7035 and targets at 0.7100 and 0.7090.
GBP/USD
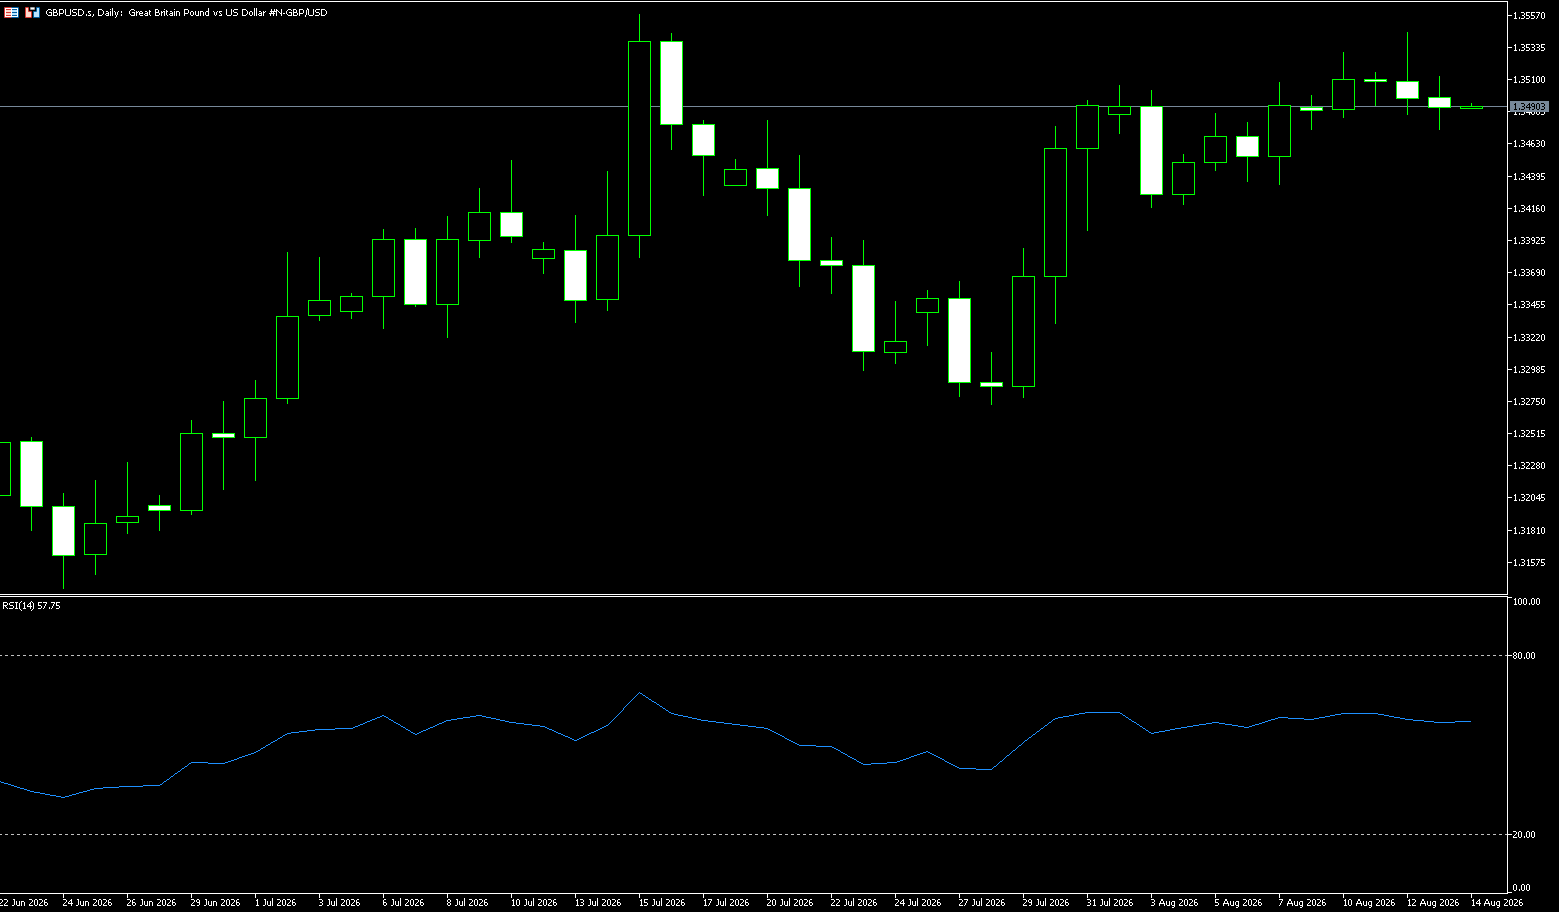
The GBP/USD pair maintained a bearish bias for the second consecutive day during Thursday's Asian session, trading below the psychological level of 1.3500 due to a modest strengthening of the US dollar. However, downside appears limited as traders may choose to wait for the release of UK macroeconomic data, including the UK's Q2 GDP report, before making directional bets. Meanwhile, inflation risks stemming from oil price volatility supported the prospect of a Federal Reserve interest rate hike. Coupled with the ongoing geopolitical uncertainty arising from the US-Iran standoff, this helped the dollar extend its rebound from the previous day's post-CPI lows, becoming a key factor suppressing the pound/dollar exchange rate. On the other hand, for the pound, current market focus is not only on dollar movements but also on the UK's domestic economic performance and the Bank of England's future policy direction. Recent pound movements have been more driven by market sentiment, with a high correlation between the pound and risk reversal indicators. The lower cost of downside protection for the pound reflects a slight easing of market concerns about short-term risks. However, as the dollar remains supported by inflation expectations and safe-haven demand, the pound/dollar exchange rate still faces short-term pressure.
From a technical perspective, aside from the overnight bullish surge, spot prices have been oscillating within the range formed over the past week. This can be categorized as a bullish consolidation phase within the context of the upward trend since late July. Furthermore, GBP/USD maintains a slightly bullish short-term bias on the 4-hour chart, above the 100-period simple moving average. However, momentum indicators offer weak support. In fact, the 14-period Relative Strength Index (RSI) is hovering near the neutral 50 level, while the Moving Average Convergence/Divergence (MACD) has slipped slightly below the zero line. This, in turn, suggests that price action is more likely to continue consolidating rather than forming strong short-term directional confidence, thus requiring caution from aggressive traders. Meanwhile, a further break below the current pivot area around 1.3480 could trigger some technical selling, risking a faster decline towards the 100-period simple moving average around 1.3415. If these support levels hold, the bullish bias will remain towards the resistance zone of 1.3550-1.3600. A break above this zone could lead to a further challenge of the 1.3650 area.
Consider going long on GBP at 1.3485 today, with a stop loss at 1.3474 and targets of 1.3550 and 1.3560.
USD/JPY
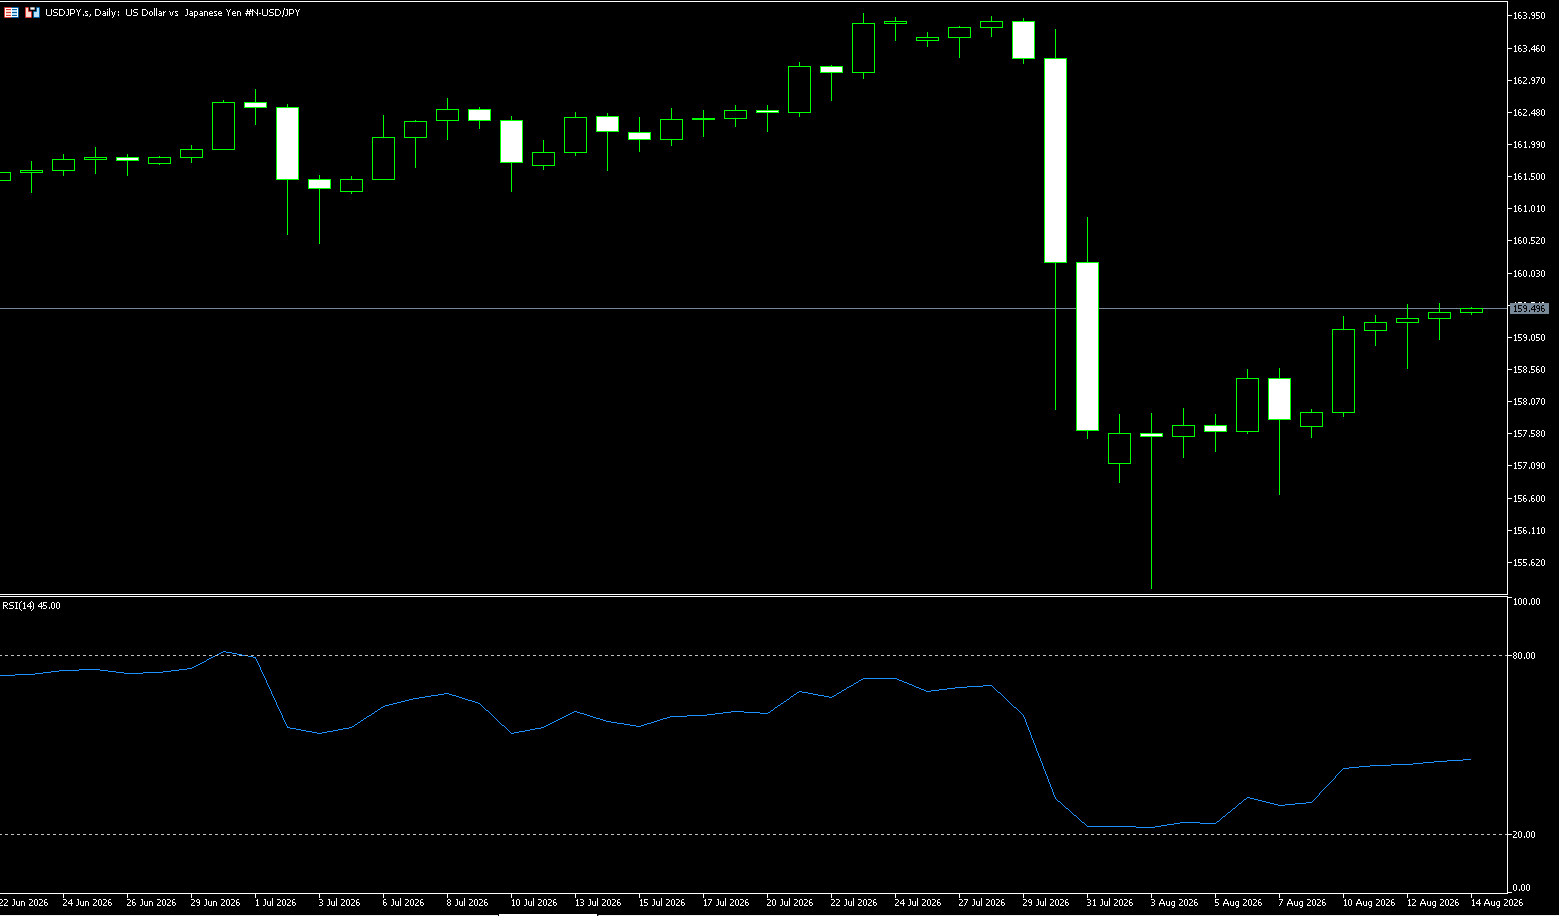
USD/JPY was flat around 159.40 during Thursday's Asian trading session. The potential upside for the pair may be limited due to coordinated intervention in the foreign exchange market by US and Japanese authorities. The US July Producer Price Index (PPI) report will be released later on Thursday. Japanese Finance Minister Satsuki Katayama stated earlier this month that the US had intervened in the foreign exchange market in conjunction with Japan to address the recent sharp fluctuations and volatile movements of the yen. US President Trump confirmed US involvement in the intervention at a cabinet meeting, calling it a "signal of friendship." Traders will be closely watching the psychological level of 160.00, as it is considered a clear threshold that could trigger a new round of coordinated or individual yen buying operations from Tokyo. The Bank of Japan's July meeting summary indicated that policymakers discussed accelerating the pace of interest rate hikes due to the potential for upside inflation risks to push inflation above the 2% target. Following the June rate hike, the Bank of Japan may consider another rate hike at its next policy meeting in September, given the rising risks of higher inflation.
USD/JPY is trading at 159.40. Remaining below the 20-day simple moving average at 160.66, the pair maintains a short-term bearish bias, indicating that the recent rally remains capped by upward trend resistance. Momentum has stabilized after previous oversold readings, and the Relative Strength Index (RSI) has risen to around 43, but this only suggests that downward pressure is easing, not a clear bullish reversal while prices remain below the short-term simple moving average. Meanwhile, as long as the 200-day simple moving average holds above 158.19, the overall bias remains towards an upward move to the 160.00 level. Resistance: The key level of 160.00 is crucial, as it represents a level that authorities have previously defended and could become a target for a new round of intervention. Not far above, the 65-day simple moving average (65-day) and the psychological level of 161.00 form a double resistance. Support: 159.00 is the first level of support, followed by the 200-day simple moving average near 158.19, which was recovered last week and continues to rise.
Consider shorting the US dollar at 159.60 today, with a stop loss at 159.80 and targets at 158.70 and 158.60.
EUR/USD
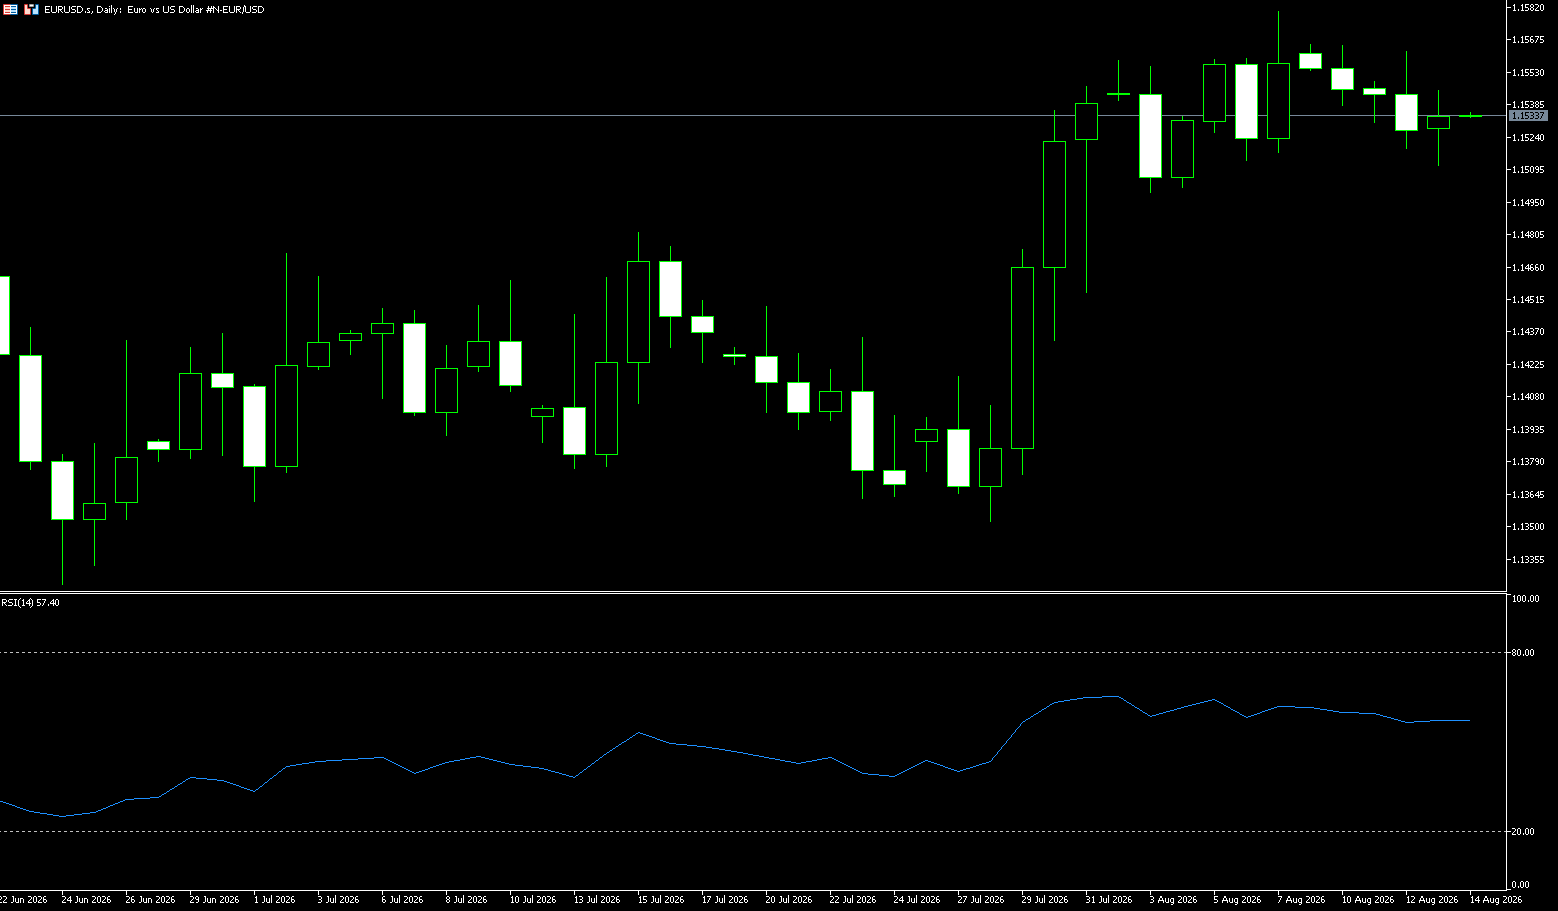
The euro/dollar pair ended a three-day losing streak during Thursday's Asian session, trading around 1.1530. The pair rose as the dollar faced challenges following the release of the US July Consumer Price Index (CPI) report. US inflation slowed across a broad range of goods and services, significantly cooling market expectations for an aggressive Fed rate hike in September. Market expectations for future Fed policy changes have been adjusted in light of the new inflation data. However, the upward momentum of the risk-sensitive euro/dollar pair may still be limited by escalating geopolitical tensions between the US and Iran. A senior Iranian official noted that Washington and Tehran remain deadlocked on a permanent end to the Gulf conflict, with no progress made in restoring the interim agreement or setting an implementation timetable; meanwhile, the Eurozone's macroeconomic outlook continues to support the ECB's hawkish stance. Market-based inflation expectations for the Eurozone over the next year are around 2.4%, still above the ECB's official 2% target, while real inflation rose to 2.9% in July.
From a daily chart perspective, the euro/dollar pair maintains a neutral to slightly bullish bias. The pair remains above the psychological level of 1.1500 and the 50-day simple moving average of 1.1464. The 14-day Relative Strength Index (RSI) is near 56, while the Moving Average Convergence Divergence (MACD) remains in positive territory. Meanwhile, the EUR/USD rally remains capped below the 100-day simple moving average at 1.1566 and the 50.0% Fibonacci retracement level of the May-June decline at 1.1562. A break above this resistance zone would target 1.1600 (the psychological level) and 1.1620 (near the monthly high). This suggests that any upward attempts are likely to be suppressed as long as these levels limit gains. On the downside, initial support lies at the psychological level of 1.1500 and the 50-day simple moving average at 1.1464; further downside targets the 23.6% retracement level at 1.1437, where buyers may attempt to stabilize the spot price.
Today, consider going long on the Euro at 1.1516, with a stop-loss at 1.1505 and targets at 1.1570 and 1.1560.
Stock Analysis:
Australian ASX 200 Stock Index
Basic Market Overview:
The Australian Securities Exchange (ASX) 200 index fell 21 points, or 0.2%, to close at 9,188 on Thursday, marking its second consecutive day of weakness, primarily dragged down by significant declines in communications, logistics, and manufacturing. Australia's tightening monetary policy kept market sentiment cautious, with Reserve Bank Assistant Governor Chris Kent emphasizing the need to maintain a tight policy to curb inflation. In China, a major trading partner, policymakers indicated no large-scale easing and warned that history shows aggressive stimulus often leads to more severe shocks, further exacerbating pessimism. Australian insurance groups fell 5.1% due to weak cash yields,
affected by declining investment income and increased claims due to severe weather. Commonwealth Bank fell 2.2%, although ANZ rose 4.5% after a slight increase in profits. Mining stocks generally declined, with Rio Tinto down 3.6% and Southern Aluminium down 0.6%. In contrast, the Australian Securities Exchange Limited (ASX LP) surged 9% after reporting an annual underlying profit increase of over 5%, driven by heightened global volatility that boosted trading and post-trade activity.
Sector Performance:
Advancing Sectors:
Utilities (+2.78%), Information Technology (+0.85%), Consumer Staples (+0.74%), and Healthcare saw slight gains, with funds shifting towards defensive sectors.
Declining Sectors:
Industries, Energy, Materials, and Real Estate led the market decline; the communications sector remained weak.
Technical Analysis:
The ASX 200 closed at 9188 points on Thursday, down 21 points, or 0.20%, marking its second consecutive day of losses. The index trended weakly, with both highs and lows gradually declining. Sector rotation was evident, with cyclical resource stocks under pressure and defensive sectors showing strength. Market breadth contracted, with new funds remaining on the sidelines, awaiting new catalysts. The Reserve Bank of Australia's Deputy Governor stated that monetary policy needs to remain tight, as inflation has not yet reached its target, leading the market to postpone expectations of interest rate cuts and suppressing valuations in the banking and real estate sectors. Meanwhile, Chinese policy signals indicate no large-scale stimulus is expected, putting pressure on iron ore and industrial metals sentiment, with heavyweight mining stocks generally weakening.
Uncertainty is rising over the weekend. If the market opens with narrow fluctuations and no clear leading sector, reduce positions and minimize new openings to mitigate the risk of unexpected news over the weekend. Two consecutive days of declines have seen the index oscillate downwards from its recent highs, shifting the short-term trend from slightly bullish to slightly bearish. Prices have fallen below the 5-day moving average, indicating weakening short-term bullish momentum. The RSI is gradually declining but has not yet entered oversold territory, suggesting further downside potential. With the center of gravity shifting downwards, without external positive stimuli, Friday is likely to see range-bound trading; be wary of late-day volatility (end-of-week profit-taking). Friday's Market Scenario Forecast: Optimistic Scenario: Overnight US stock market rebound and commodity price rally → Opening rebound, testing 9215; a valid breakout is needed to restore sentiment; Neutral Scenario: Maintaining range-bound trading between 9150 and 9215, with funds mainly observing towards the end of the week; Pessimistic Scenario: Losing support at 9150, testing 9110, with cyclical stocks facing further pressure.
Trading Strategies:
Friday Trading Strategy (Short-Term Approach)
Bull Strategy (Cautious Long Positions)
• Entry Conditions: Consider going long only if the price retraces to around 9150 and stabilizes, with intraday buying support.
• Target: 9215; Stop Loss: A decisive break below 9135.
• Restrictions: Avoid chasing highs; do not take large long positions if the rebound is weak.
Bear Strategy (Trend Following)
• Entry Conditions: Consider going short if the price rebounds to 9215 but fails to break through resistance.
• Target: 9150 → 9110; Stop Loss: Exit if the price holds above 9235.
Wait and See (Preferred)
Uncertainty increases towards the end of the week. If the market opens with narrow volatility and no clear leading sector, reduce positions and minimize new openings to mitigate the risk of unexpected news over the weekend.
Key Risk Warnings:
China Demand Expectation Risk: Iron ore and industrial metal prices directly impact the weighting of Australian resources, and changes in domestic macroeconomic expectations will quickly transmit to the ASX200.
Australian Interest Rate Expectation Disruption: Continued hawkish comments from Reserve Bank officials have further delayed market expectations of interest rate cuts, continuously suppressing the banking and industrial sectors.
External Linkage Risk: Overnight fluctuations in US stocks, US Treasury yields, and international oil prices will directly affect the opening of Friday's trading session.
New Zealand Stock Market (NZX 50)
Basic Market Overview:
The New Zealand stock market rose 88 points, or 0.6%, to close at 13,825 on Thursday, erasing losses from the previous two days. This followed an overnight positive performance from Wall Street, as moderate inflation reduced market expectations for an upcoming Federal Reserve rate hike. The broad index rebounded from its lowest level since August 3, primarily driven by gains in the financial, consumer goods, healthcare, and industrial sectors. The decline in oil prices also improved market sentiment, as easing concerns about inflation reduced market expectations for a tightening of monetary policy by the Reserve Bank of New Zealand.
Latest data shows that the Reserve Bank of New Zealand's quarterly expectations survey indicates business managers anticipate inflation to slow to 2.34% over the next two years by the third quarter of 2026, the lowest level since the fourth quarter of 2025. Major gainers included ANZ Group (5.2%), Mainfreight (3.1%), Westpac (2.9%), A2 Milk (1.7%), Fisher & Paykel (1.4%), Freightways Group (1.1%), and Contact Energy (1.1%).
Sector Performance:
Leading Sectors (Defying the Trend):
Banking & Financials (ANZ, Westpac), Transportation (Mainfreight), Healthcare, Consumer Staples (A2 Milk, Fisher & Paykel)
Lagging Sectors (Drag Down the Market):
Utilities & Energy, Real Estate & Infrastructure saw limited gains, lacking concentrated capital inflows.
Technical Analysis:
The New Zealand stock market index ended a two-day correction, stabilizing and rebounding from its low of around 13737 since August 3rd. Overnight, improved risk sentiment in US stocks boosted overseas markets, coupled with the Reserve Bank of New Zealand announcing a decline in third-quarter business inflation expectations to 2.34%, leading to a downward revision of market expectations for further interest rate hikes, supporting the local stock market recovery. Closing price: 13825.31, up 87.65 points for the day, a gain of +0.60%; the market initially declined before rising, testing support in the morning session before buying pressure emerged in the afternoon; trading volume increased moderately, but without a significant increase in funds; there is still significant resistance before reaching the year's high of 14012, indicating a technical rebound rather than a reversal of the short-term consolidation pattern.
The RSI indicator has rebounded from a low to the neutral zone and has not yet entered overbought territory; the MACD histogram is converging, with no clear golden cross yet, suggesting a primarily volatile rebound rather than a strong bullish trend. On the 4-hour chart: a small bottom structure has formed, but multiple moving averages above are providing resistance, limiting the rebound's potential. A break above 13915: the rebound will continue, potentially challenging the previous high; continued resistance below 13915: range-bound trading will continue; a break below 13735: a second bottoming attempt will begin. Friday's Market Scenario Prediction: Optimistic Scenario (40% probability): US stock futures remain strong, the index breaks through 13915, targeting 13980-14012; a pullback is likely near the previous high. Neutral Scenario (50% probability): The market fluctuates between 13780 and 13915, with weak upward momentum and support on pullbacks, a typical sideways market. Pessimistic Scenario (10% probability): External risk sentiment cools, the index breaks below the 13780 support level, and retests the 13735 low.
Trading Strategy:
Bull Strategy
• Consider a small long position if the price retraces to the 13785-13805 range and stabilizes.
• Stop Loss: Below 13730
• First Take Profit: 13890; Second Take Profit: 13980
Important: Do not chase the price near the previous high of 14000; be wary of a potential pullback.
Bear Strategy
• Consider a short position if the price rallies to 13890-13915 and encounters resistance.
• Stop Loss: Above 13945
• First Target: 13800; a break below this level could target 13740.
Key Risk Warning:
External Risks (Most Significant Impact)
Fluctuations in the New Zealand dollar exchange rate, overnight fluctuations in US stocks, and a renewed rise in international oil prices are pushing up global inflation expectations. If inflation concerns resurface, the market will reprice expectations of a Reserve Bank of New Zealand rate hike, suppressing the equity market.
Domestic Fundamental Risks
New Zealand inflation data is fluctuating; changes in dairy export sentiment directly impact heavyweight consumer stocks like A2 Milk; volatile Chinese demand prospects affect New Zealand's export sector.
Technical Risks
This rebound is a correction after a sharp drop, not a new upward trend; the year-to-date high of 14012 presents strong resistance, and repeated failed attempts to break through could trigger significant profit-taking.
Disclaimer: The information contained herein (1) is proprietary to BCR and/or its content providers; (2) may not be copied or distributed; (3) is not warranted to be accurate, complete or timely; and, (4) does not constitute advice or a recommendation by BCR or its content providers in respect of the investment in financial instruments. Neither BCR or its content providers are responsible for any damages or losses arising from any use of this information. Past performance is no guarantee of future results.
More Coverage





Risk Disclosure:Derivatives are traded over-the-counter on margin, which means they carry a high level of risk and there is a possibility you could lose all of your investment. These products are not suitable for all investors. Please ensure you fully understand the risks and carefully consider your financial situation and trading experience before trading. Seek independent financial advice if necessary before opening an account with BCR.
BCR Co Pty Ltd (Company No. 1975046) is a company incorporated under the laws of the British Virgin Islands, with its registered office at Trident Chambers, Wickham’s Cay 1, Road Town, Tortola, British Virgin Islands, and is licensed and regulated by the British Virgin Islands Financial Services Commission under License No. SIBA/L/19/1122.
Open Bridge Limited (Company No. 16701394) is a company incorporated under the Companies Act 2006 and registered in England and Wales, with its registered address at Kemp House, 160 City Road, London, England, EC1V 2NX. Open Bridge Limited acts solely as a payment processor for BCR Co Pty Ltd and does not provide any financial, trading, or investment services on its behalf. Open Bridge Limited's role is limited to payment processing.


 English
 简体中文
简体中文
 繁體中文
繁體中文
 Bahasa
Melayu
Bahasa
Melayu
 Tiếng
Việt
Tiếng
Việt
 ไทย
ไทย
 日本語
日本語
 한국어
한국어
 ភាសាខ្មែរ
 español