


0
US Dollar Index
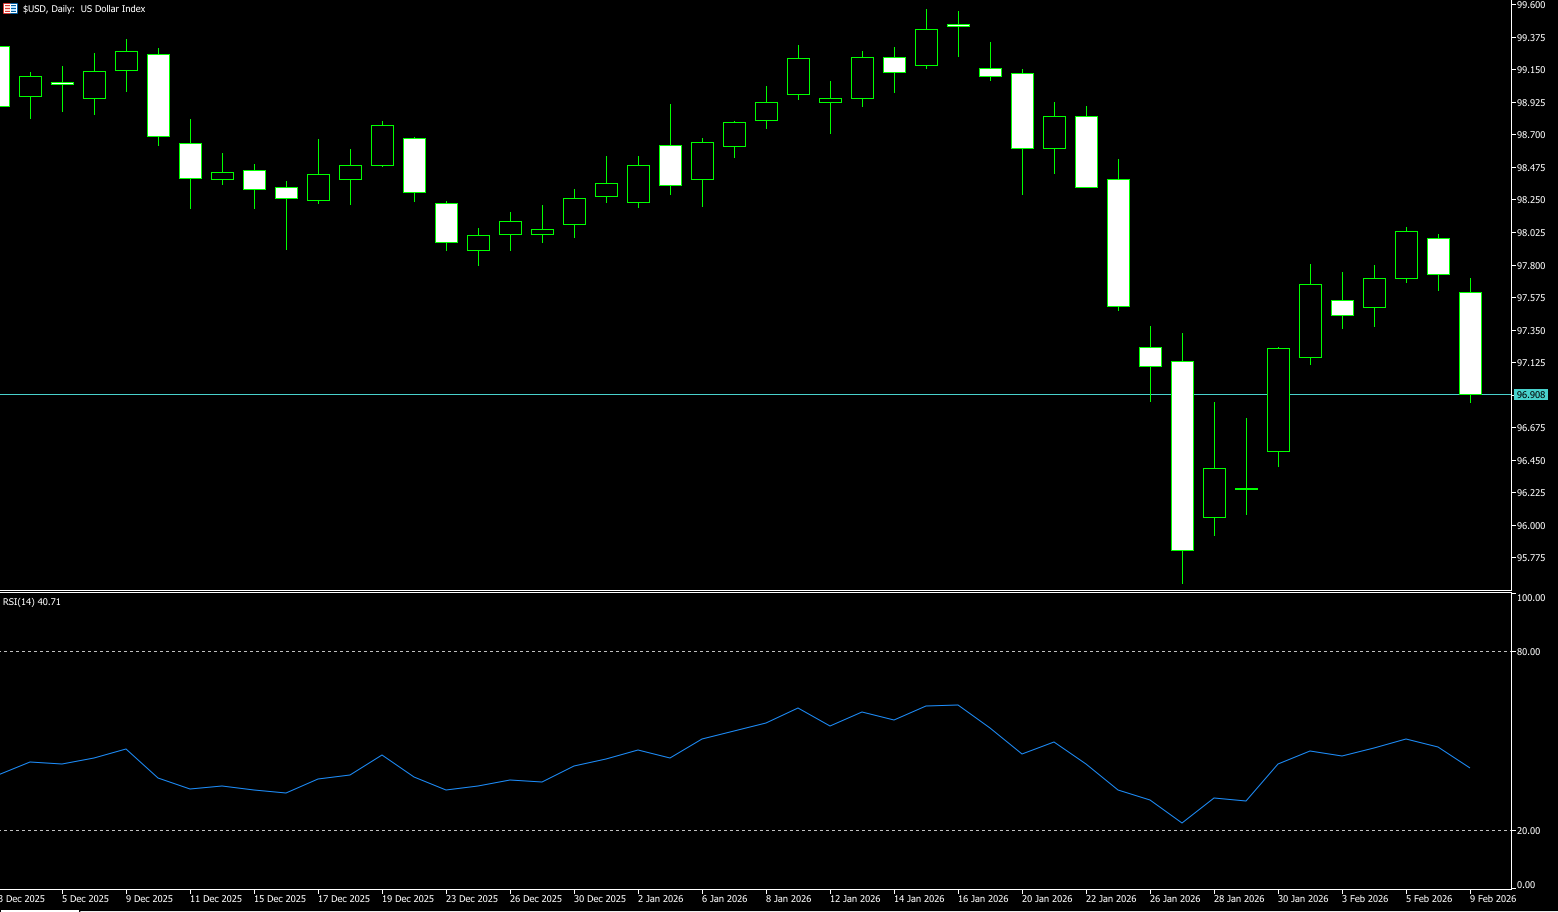
The US dollar index fell below 97 on Monday, eroding last week's rebound, as G10 currencies strengthened and renewed concerns arose about a potential shift in global markets towards non-dollar-denominated assets. Chinese regulators advised financial institutions to limit their exposure to US Treasuries to address concentration risk and the impact of uncertain economic policies in Washington. This move echoed similar rhetoric from other major economies that have expressed greater unease about overstating their exposure to US assets, including European pension funds that reduced their holdings of Greenland Treasuries following hawkish comments from the White House. Traders also remained cautious ahead of a series of US economic data releases this week, including the jobs report and the Consumer Price Index (CPI). Meanwhile, the yen strengthened as Prime Minister Sanae Takashi's overwhelming victory fueled expectations that her loose fiscal policies could lead to foreign exchange intervention.
After climbing to an annual high near 99.50 earlier this month, the US dollar index faced new and rather persistent selling pressure. Despite this, the index retreated to the 95.56 area after a sharp sell-off in late last month, subsequently almost completely retracing that move in the final days. Meanwhile, the index broke below its key 200-day simple moving average near 98.57 and continues to show a downtrend. From here down, the next support levels are at 97.07 (the 9-day simple moving average) and the 97.00 (psychological level) area. A deeper pullback could bring the 2026 low of 95.56 back into view, followed by the 95.00 level. On the other hand, bulls need to break through the 98.00 (psychological level) again, which could lead to a test of the 200-day simple moving average at 98.57. Higher resistance lies at the 99.00 psychological level.
Today, consider shorting the US Dollar Index around 96.98; Stop loss: 97.10; Target: 96.50; 96.40
WTI Crude Oil
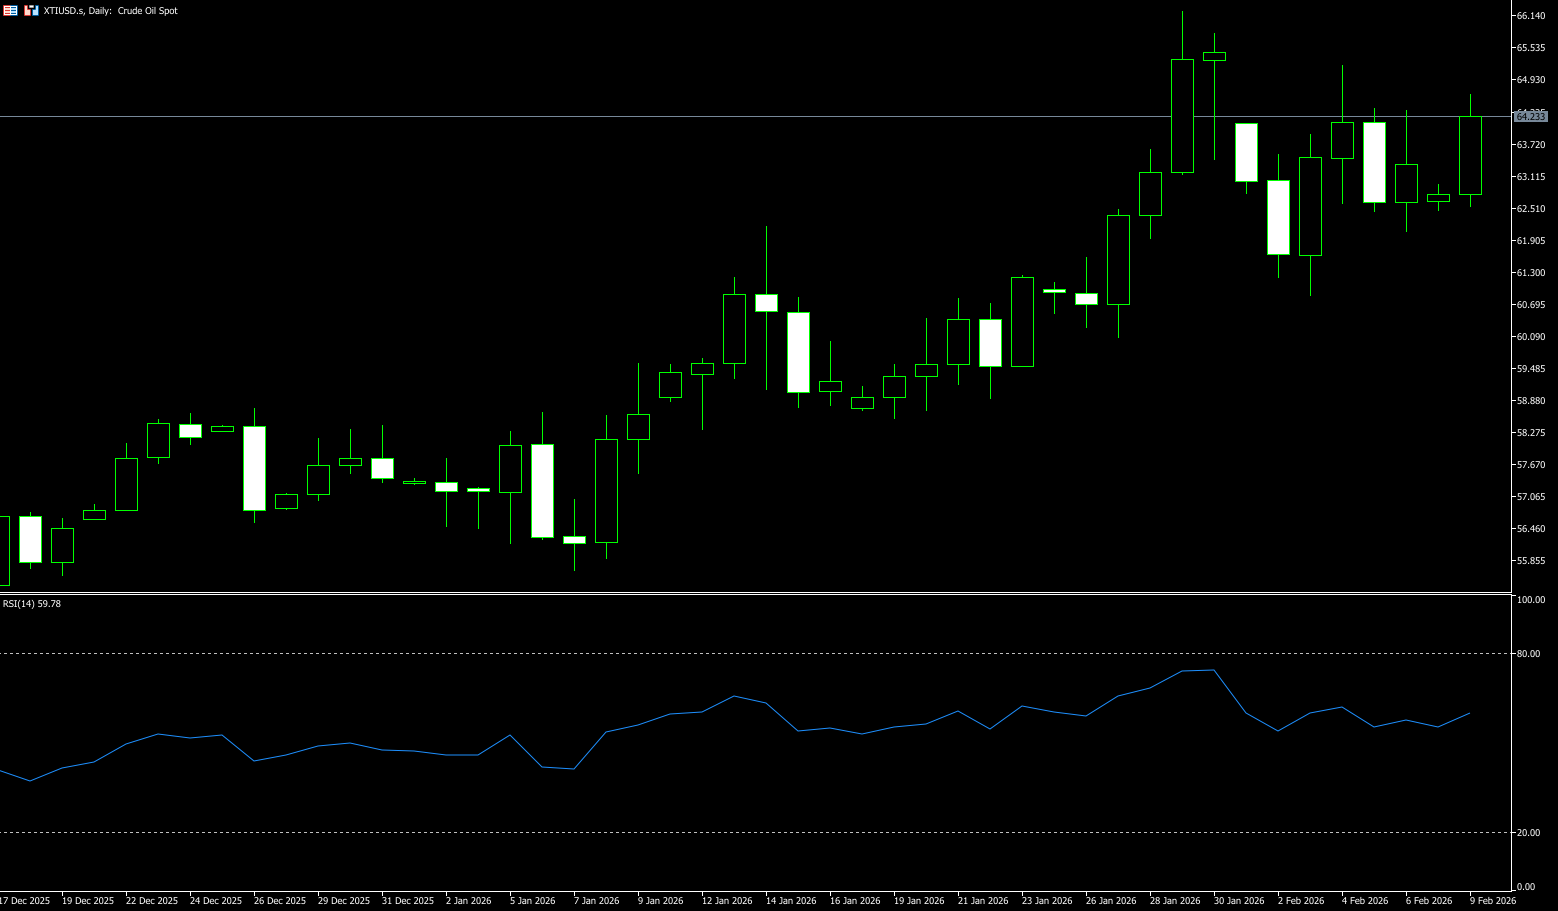
WTI crude oil rose above $64.30 per barrel on Monday as the market continued to assess its appropriate risk premium. US President Trump expressed some optimism about negotiations with Iran, involving a potential agreement to ease Iran's uranium enrichment capacity. Oil prices surged in previous weeks due to escalating tensions between the two countries, and the market began to consider the increased risk of US sanctions on Iranian oil and the possibility of Iranian authorities intercepting tankers through the Strait of Hormuz. The rising risk premium offset narratives of oversupply in the oil market caused by cumulative production increases in OPEC countries and strong production from countries such as the US, Canada, and Brazil. Finally, uncertainty exists regarding India's oil imports, as its trade agreement with the US includes a condition ceasing purchases from Russia, hindering significant changes to contracts with Indian refiners.
Despite the weekly decline ending a six-week winning streak, Friday's rebound and the typical technical pattern of the weekly candlestick suggest that the market may face a directional decision in the next phase. Technically, WTI crude oil's weekly candlestick closed as a classic "long-legged doji." This candlestick has a very small body (almost a horizontal line) but is accompanied by very long upper and lower shadows. This pattern is a classic signal that the market's bullish and bearish forces have reached a temporary balance at the current level, indicating a heated battle and usually foreshadowing the exhaustion of the existing trend's momentum and a potential major reversal. Traders are generally watching closely; if the closing price of the next candlestick is lower than the body of this doji, it may confirm a downtrend reversal. The targets are $62.04 (200-day simple moving average) and $60.88 (last week's low); conversely, a close above the body would suggest the current uptrend may find some breathing room and extend to $65.23 (February 4 high) and $66.00 (psychological level).
Consider going long on crude oil around $64.15 today; stop loss: $6400; targets: $65.50; $65.80
Spot Gold
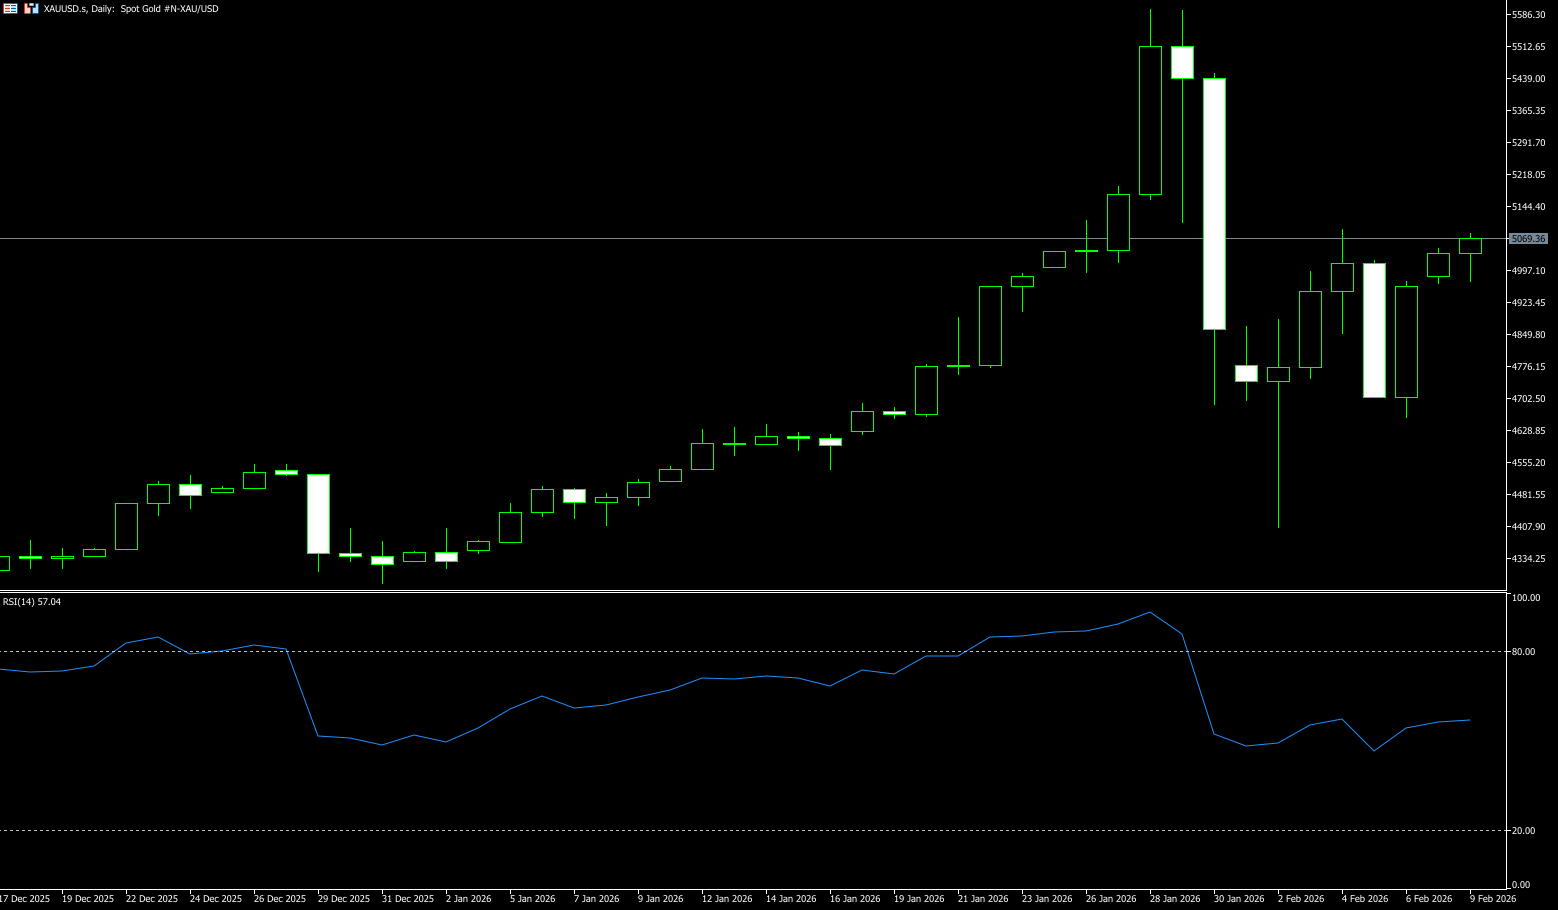
Gold rose more than 2% on Monday to around $5,070 an ounce, its highest level in over a week, driven by softer real yields, a weaker dollar, and renewed demand for safe-haven assets, fueling the price increase ahead of key U.S. data releases. The New York Federal Reserve's one-year inflation expectations fell to a six-month low of 3.1% in January, easing Treasury yields and increasing the attractiveness of gold. Recent signals from the Federal Reserve, including Mary Daly's openness to one or two rate cuts and the risk of weaker-than-expected employment and CPI data this week, have further strengthened expectations for easing policies. The People's Bank of China increased official gold purchases for the fifteenth consecutive month, supporting stable institutional demand. Meanwhile, negotiations between the US and Iran reduced the risk of direct conflict but did not eliminate broader geopolitical tail risks, maintaining stable hedging demand. The rebound was amplified by position rebuilding following the end-of-January liquidation and ETF inflows.
Besides fundamental factors, geopolitical risks remain a significant driver of safe-haven buying. As long as geopolitical tensions do not ease significantly, a one-sided decline in gold prices is unlikely. From a technical perspective, the current chart also reveals positive signals. The MACD indicator's red bars are gradually expanding, reflecting weakening bearish momentum and increased bullish recovery intentions; the Relative Strength Index (RSI) is running at 57.96, in a neutral-to-strong range, neither overheating nor lacking upward potential, while also showing some support. Structurally, $4,655 (last Friday's low) and $4,648 (the 40-day moving average) are considered important support levels. A break below these levels could trigger a new round of risk release. Above these, watch $4,887 (the 20-day moving average); and on the upside, $5,092 (last week's high). A break below this level would target $5.182 (the high of January 27th). If a decisive breakout fails, the market will likely enter a period of high-level consolidation, digesting selling pressure over time.
Consider going long on gold around 5,050 today; Stop loss: 5,040; Target: 5,120; 5,130
AUD/USD
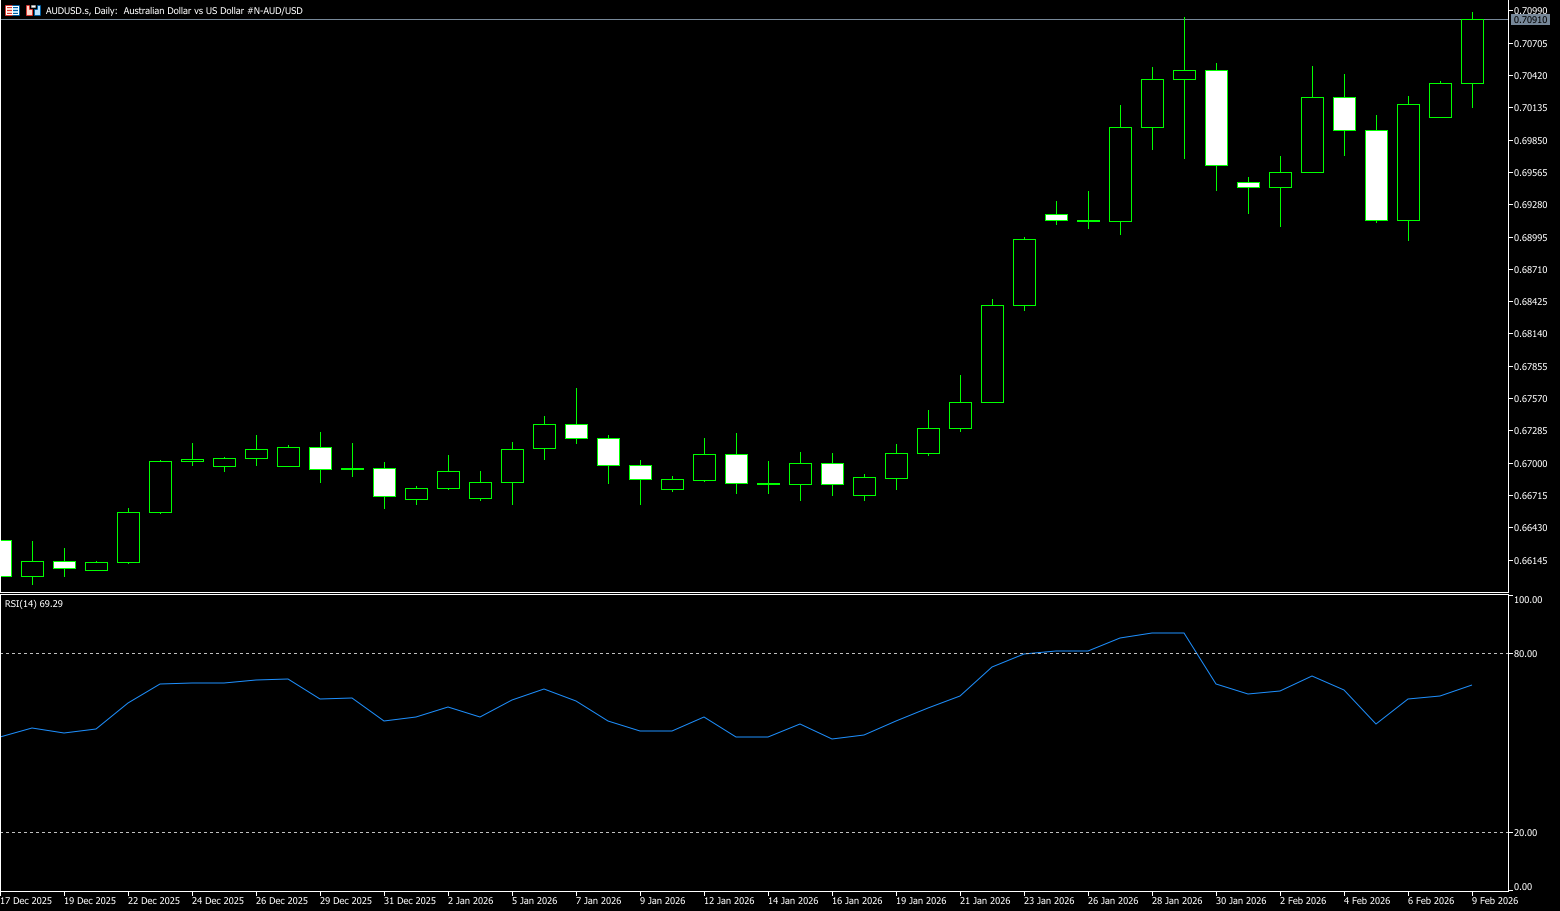
The sharp sell-off in the US dollar supported the Australian dollar's solid performance on Monday, prompting AUD/USD to increase its recent gains as it challenges the key 0.7100 resistance level, potentially reaching a new high for the year. The Australian dollar also received support after RBA Governor Michelle Bullock stated that the board's increase in the official cash rate meant that policy needed to tighten further. Australian household spending fell 0.4% month-on-month in December 2025, reversing the previous month's 1.0% growth and missing market expectations of a 0.2% increase. Additionally, the risk-sensitive AUD/USD pair rose after Iranian President Pesshkian's nuclear negotiations with the US last week were described as a "step forward" and rejected threats. Meanwhile, US President Trump stated that another meeting is planned this week and warned of "very serious" consequences if no agreement is reached.
The AUD/USD pair traded slightly below the 0.7100 level at the start of the week. Daily chart analysis shows the pair is within an ascending channel pattern, indicating potential bullish continuation. The 14-day Relative Strength Index (RSI) on the daily chart is at 74, suggesting continued bullish momentum. The pair has broken above the immediate resistance at last week's high of 0.7050. A continued rally this week would strengthen the bullish bias, targeting 0.7094, the highest level since February 2023, reached on January 29th. A break above this level would support a test of the 0.7150 level. On the downside, the 14-day simple moving average at 0.6957 is the first support level. Further major support lies at 0.6900 (psychological level) - 0.6880 (20-day moving average), where strong support has been tested multiple times without breaking, casting doubt on the continuation of the bearish trend.
Consider going long on the Australian dollar around 0.7077 today; Stop loss: 0.7065; Target: 0.7140; 0.7150
GBP/USD
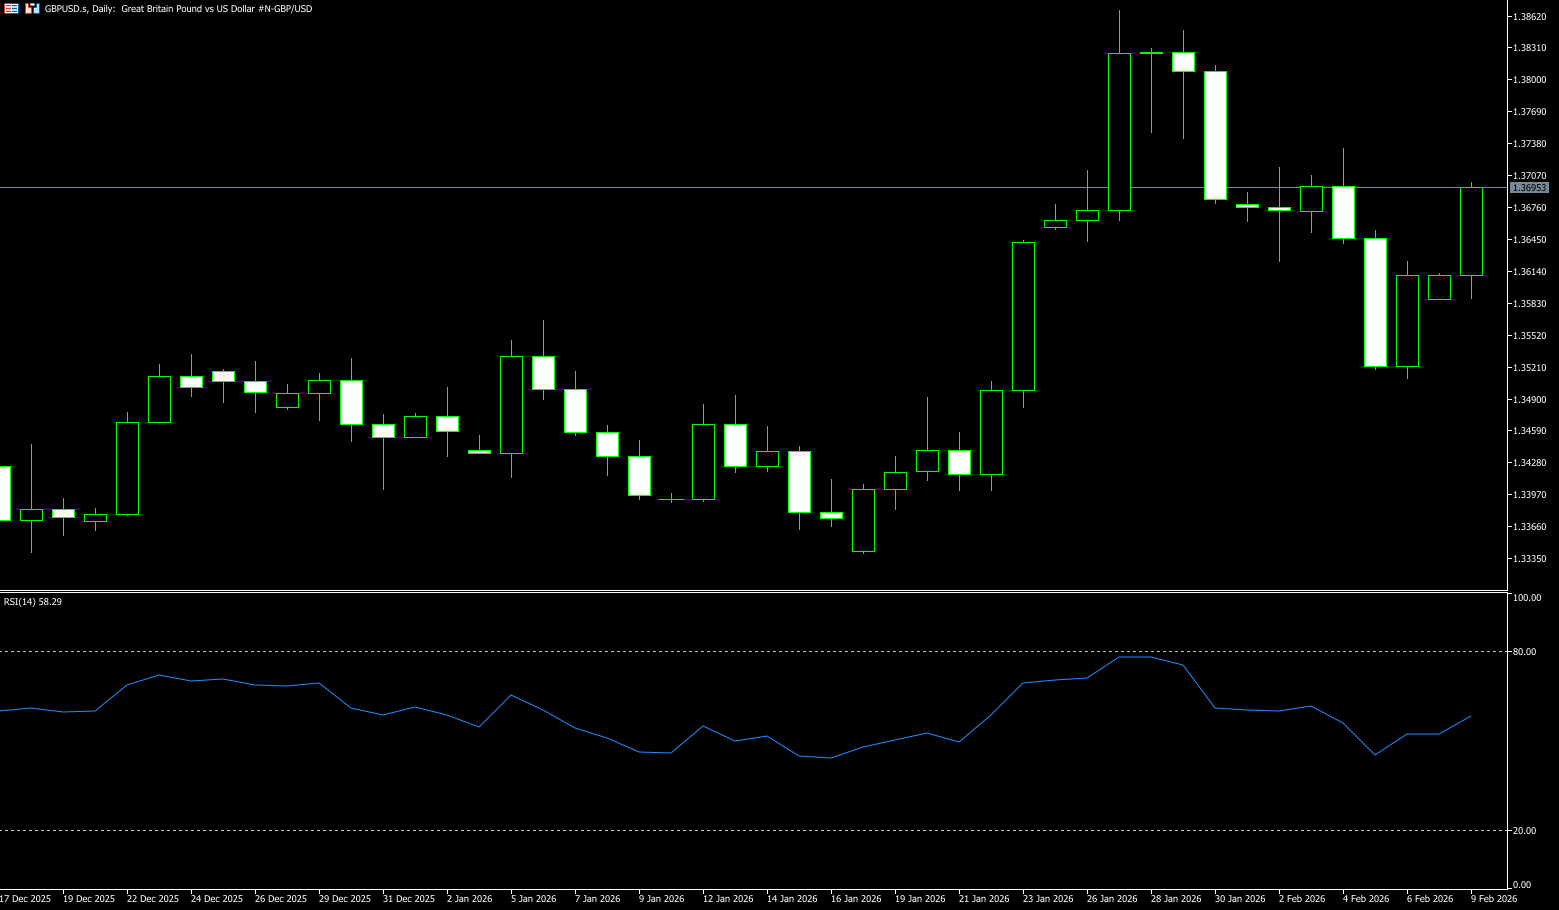
The pound rose sharply against the dollar on Monday as news of China demanding a reduction in exposure to US Treasury bonds put pressure on the dollar. However, the pair remains constrained by political turmoil in the UK. GBP/USD is trading at 1.3690. The Bank of England kept interest rates unchanged at 3.75% at its first meeting in 2026 last week. The Bank of England has hinted at a high probability of an imminent interest rate cut, stating that its monetary policy is designed to ensure that inflation "not only reaches 2%, but is sustainably maintained at that level over the medium term." The next rate cut is expected in March. Afterward, the Bank of England will maintain a long pause until early 2027 to resume policy normalization. Rumors that Prime Minister Keir Starmer may resign on Monday could put pressure on the pound/dollar exchange rate. Starmer is facing increasing pressure due to the impact of the Mandelson-Epstein scandal and growing discontent within his party. Starmer is expected to meet with MPs at the Labour Party conference on Monday and is anticipated to engage further with various factions within the party.
(From the daily chart,) GBP/USD found some support around 1.3600 early in the week, representing the 50% Fibonacci retracement level from the January lows, which should now be a key turning point for traders. The MACD indicator remains below zero, with the MACD line below the signal line and the histogram contracting, suggesting weakening bearish momentum. The Relative Strength Index (RSI) is near 52, suggesting that downward pressure has eased. Meanwhile, the 61.8% Fibonacci retracement is at 1.3548, providing downside support; a break below this level would warn of a deeper deterioration towards the 1.3500 level. At this stage, GBP/USD appears poised for a rebound, but the bulls are not yet out of the woods. They must close the trade above 1.3700 to maintain hopes of testing the February 4 high of 1.3734, with a target of 1.3800.
Consider going long on GBP around 1.3685 today; Stop loss: 1.3672; Target: 1.374. 1.3750
USD/JPY
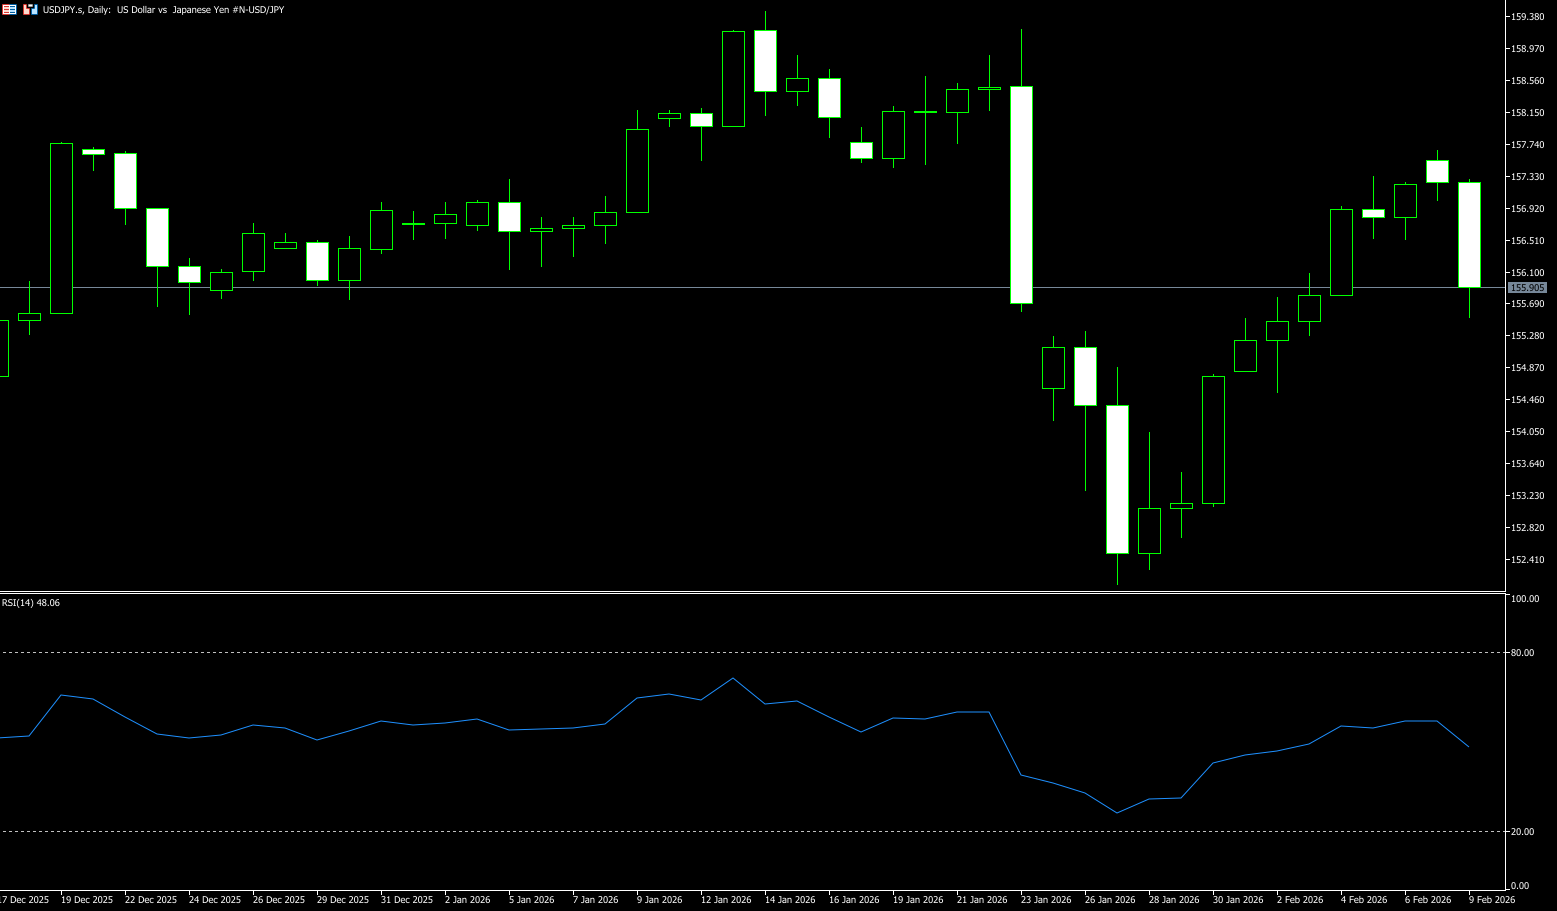
USD/JPY started the week significantly on the defensive, retreating to the 155.50 area, where it is currently encountering considerable resistance. The decline in the spot market is due to discussions of foreign exchange intervention following Prime Minister Sanae Takaichi's landslide victory in Sunday's election. The yen weakened against the dollar after Japan's ruling Liberal Democratic Party (LDP) won an absolute majority in Sunday's House of Representatives election, providing Prime Minister Fumio Kishida with more room for fiscal stimulus. Takaichi's LDP coalition won 352 of the 465 seats in the House of Representatives, giving the LDP a majority of 316 seats. On the other hand, intervention by Japanese authorities could help limit the yen's depreciation. Finance Minister Kaoru Katayama said on Sunday that she would communicate with the market on Monday if necessary, following Takaichi's historic election victory. Katayama reiterated that she is in close contact with US Treasury Secretary Scott Bessenter to maintain the stability of the currency pair. Traders will be closely watching the delayed release of the US January jobs report on Wednesday.
The USD/JPY pair was undoubtedly the most watched currency pair this week. After rising for five consecutive trading days, achieving a five-day winning streak and a weekly gain of 1.60%, the pair saw a technical pullback at the beginning of the week. Technically, USD/JPY had previously broken through the 156.50 level and held above the 89-day moving average at 155.25, confirming a short-term bullish technical structure. Currently, this moving average continues to rise slowly, and the price remains above it, indicating that the overall trend is still bullish, but the upward momentum has slowed. In terms of momentum indicators, the MACD shows signs of a death cross near the zero line, with the histogram gradually turning negative and expanding, suggesting weakening short-term bullish momentum. Therefore, support levels to watch are 155.00 (the psychological level) and 155.25 (the 89-day moving average). Then there's 154.55 (the low of the second day of this month), while on the upside, watch 157.66 (Monday's high). And the psychological level of 158.00.
Consider shorting the US dollar today around 156.10; Stop loss: 156.30; Target: 155.20; 155.00
EUR/USD
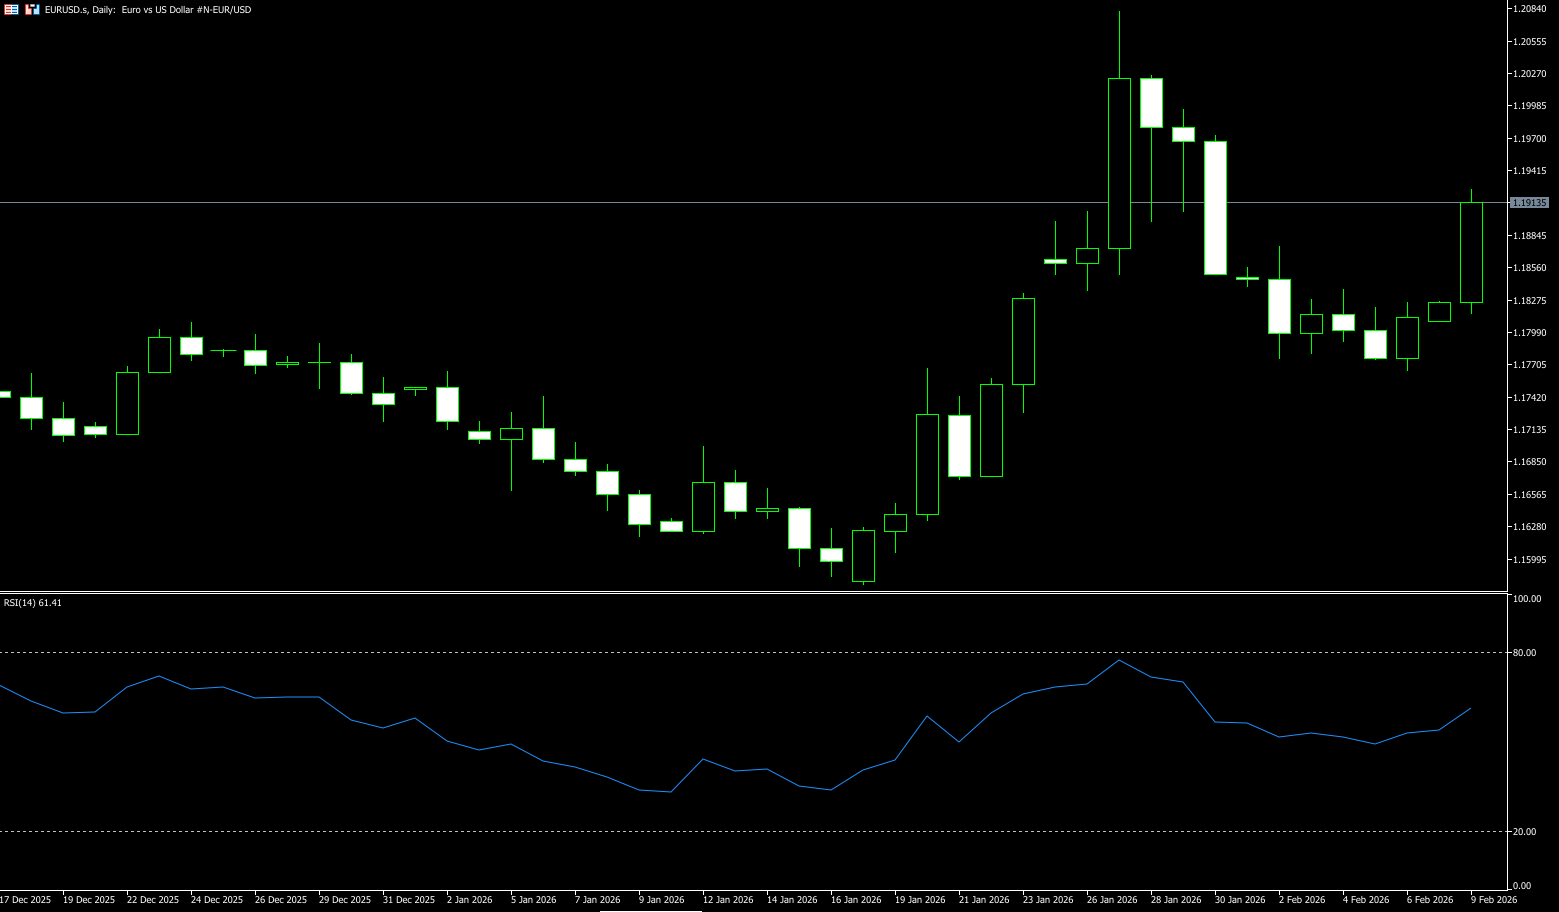
EUR/USD maintained strong fundamental buying support, breaking through the 1.1900 level at the close of North American trading on Monday, marking a one-week high. The pair's continued upward trend occurred as the US dollar held a defensive stance, with traders remaining cautious ahead of upcoming US non-farm payroll and consumer price index data. Concerns about a potential conflict in the Middle East eased after the US and Iran concluded a round of talks on Friday, becoming a key bullish factor for the EUR/USD pair. Furthermore, the divergence in interest rate paths between the Federal Reserve and the European Central Bank also supports further gains in the near term. The ECB has maintained its current rate-cutting policy since ending a year-long rate-cutting cycle in June, and unexpectedly strong growth has relieved policymakers of pressure to provide further support. This is seen as another factor supporting the EUR/USD pair and validates the optimistic outlook. Meanwhile, the overall fundamental backdrop appears to favor the bulls and supports the possibility of further gains in the absence of relevant macroeconomic data from the Eurozone or the US.
The daily chart shows that the EUR/USD exchange rate is currently at the 20-day moving average of {1.1781}; The price is trading above the 50-day simple moving average (1.1739), maintaining a recent bias towards steady progress. Meanwhile, the 100-day and 200-day simple moving averages are rising slightly, keeping the price above them, but are being pressured by the shorter-term moving averages. The 14-day Relative Strength Index (RSI) is at 57, above the midline, reinforcing the bullish momentum. Measuring from the low of 1.1590 to the high of 1.2025, the 38.2% Fibonacci retracement is located at 1.1860, and the 1.1865 area (10-day simple moving average) is immediate support, followed by the 1.1800 psychological level. On the upside, 1.1974 (January 30 high) can be considered a key support level, followed by the 1.2082 level (previous high).
Consider going long on the Euro today near 1.1903; Stop loss: 1.1890; Target: 1.1950, 1.1960
Disclaimer: The information contained herein (1) is proprietary to BCR and/or its content providers; (2) may not be copied or distributed; (3) is not warranted to be accurate, complete or timely; and, (4) does not constitute advice or a recommendation by BCR or its content providers in respect of the investment in financial instruments. Neither BCR or its content providers are responsible for any damages or losses arising from any use of this information. Past performance is no guarantee of future results.
更多報導


風險披露:衍生品在場外交易,採用保證金交易,意味著具有高風險水平,有可能會損失所有投資。這些產品並不適合所有投資者。在進行交易之前,請確保您充分了解風險,並仔細考慮您的財務狀況和交易經驗。如有必要,請在與BCR開設帳戶之前諮詢獨立的財務顧問。
BCR Co Pty Ltd(公司編號1975046)是一家依據英屬維京群島法律註冊成立的公司,註冊地址為英屬維京群島托爾托拉島羅德鎮Wickham’s Cay 1的Trident Chambers,並受英屬維京群島金融服務委員會監管,牌照號碼為SIBA/L/19/1122。
Open Bridge Limited(公司編號16701394)是一家依據2006年《公司法》註冊成立並在英格蘭及威爾斯註冊的公司,註冊地址為 Kemp House, 160 City Road, London, City Road, London, England, EC1V 2NX. 本公司僅作為付款處理方,並不提供任何交易或投資服務。

 English
 简体中文
简体中文
 繁體中文
繁體中文
 Bahasa
Melayu
Bahasa
Melayu
 Tiếng
Việt
Tiếng
Việt
 ไทย
ไทย
 日本語
日本語
 한국어
한국어
 ភាសាខ្មែរ
 español